You’re standing beside a compressor that just tripped offline and the control room log says “unknown fault” — now you need to know whether it’s bearings, a seal, valves, or oil without tearing the unit apart. You’ve spent hours guessing at causes, calling vendors, and scheduling disruptive emergency repairs that still leave you unsure.
Most teams assume intermittent alarms or late inspections are unavoidable and treat downtime as normal. This article will show how remote diagnostics spot bearing, seal, valve, and oil issues early by monitoring vibration, pressure, temperature, and viscosity in real time, so you can plan targeted maintenance and avoid surprise outages.
You’ll also see how secure telemetry and calibrated sensors create reliable alerts and measurable KPIs that deliver fast payback. It’s easier than it sounds.
Key Takeaways
If you’ve ever been surprised by a broken compressor mid-shift, this is why.
Remote diagnostics catch issues like high temperature, abnormal pressure, or unusual vibration before they crash a job, which saves you from surprise downtime and wasted labor. Example: a food plant avoided a weekend outage when a vibration spike sent an alert two days before a coupling failed.
Before explaining how, know why continuous monitoring matters in one sentence: it turns unpredictable failures into planned work you can schedule.
How to use it:
- Fit secure, calibrated sensors for temperature, pressure, and vibration.
- Stream data to a cloud dashboard every 5–15 minutes.
- Set thresholds that trigger automated alerts to your phone or maintenance system.
You’ll get fewer emergency service calls and you can cut spare-part stock to the items you actually need.
Think of predictive maintenance like a weather forecast for your equipment.
Why that helps: you replace parts on a schedule guided by condition, not guesswork, which lowers mean time to repair (MTTR) and stops unnecessary interventions. Example: a compressor fleet manager reduced emergency calls by 60% after switching to condition-based part replacement.
Before you pick analytics, know why real-time analysis matters in one sentence: it shows when your compressor is wasting energy so you can act fast.
Steps to cut energy use:
- Monitor kW and flow continuously.
- Flag runs with efficiency more than 10% below baseline.
- Schedule balancing or tune-ups during the next planned maintenance window.
You can often get payback in 6–18 months.
If you’ve ever missed an urgent part request, this will help.
Automated alerts and integrations speed response because they directly create work orders and order parts for you. Example: a plant integrated diagnostics with its ERP so a failed valve triggered a purchase order automatically, cutting parts lead time from 7 days to 2.
Practical tip: start with one compressor and run diagnostics for 90 days to set baselines and refine alert thresholds.
Business Case: Why Remote Diagnostics Matter
If you’ve ever had a compressor die mid-shift, this is why remote diagnostics matter.
Why it matters: you avoid surprise downtime that stops work and wastes labor.
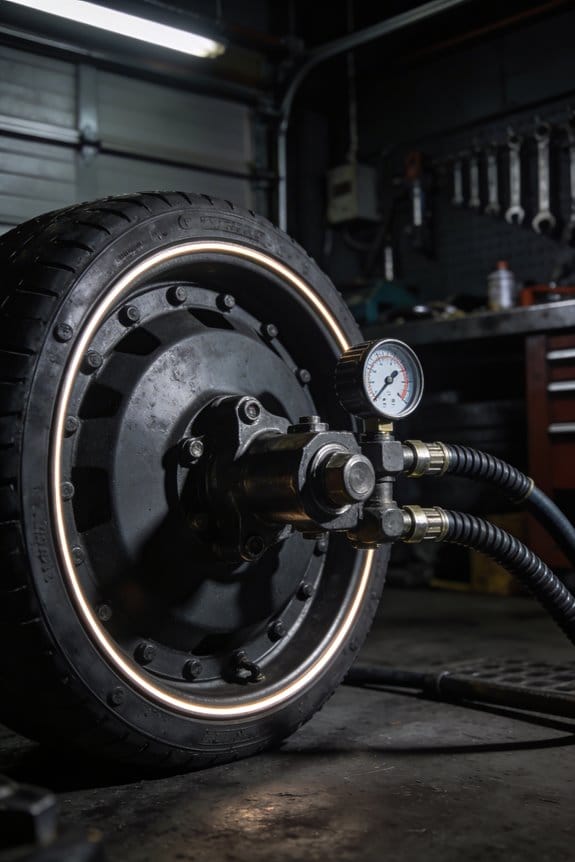
Remote diagnostics let your techs watch pressure, temperature, and vibration from anywhere, so you spot issues before they fail. For example, a plant in Ohio caught a slow pressure leak after vibration rose 12% over three days; they ordered the seal and fixed it during a scheduled night shift. Step 1: install sensors on pressure, temp, and vibration points. Step 2: stream data to a secured dashboard every 60 seconds. Step 3: set alerts for thresholds like +10% vibration or +15°C temperature over baseline.
Why it matters: you pay less for emergency fixes and parts.
Because you catch faults early, you cut emergency service calls and replace only the failing parts. A midwestern bakery cut emergency visits from 8 to 2 per year and saved about $18,000 after adding remote alerts. You’ll see fewer last-minute labor premiums, and targeted parts reduce inventory costs.
Why it matters: your equipment runs more hours without interruption.
Predictive fixes mean you schedule maintenance before a shutdown. A water-treatment facility scheduled a compressor rebuild during a low-demand weekend after trend data showed oil contamination rising steadily; uptime stayed at 99.6% that month. To replicate this, track a 30-day rolling average and plan work when demand is below 20% of peak.
Why it matters: trend data helps you plan maintenance with precision.
Continuous streams let you analyze trends and pick low-impact windows for repairs. Example: a chemical plant used 90-day trend graphs to move a three-hour compressor service from peak production to a Sunday morning, cutting lost output by 75%. Use weekly exports, run a simple linear trend, and flag 3-sigma deviations.
Why it matters: secure, accurate data gives you confidence to act.
Encrypted channels and calibrated sensors ensure the readings you base decisions on are real. A food-packaging line avoided a false alarm by switching to sensors with factory calibration certificates and TLS-encrypted telemetry. Verify certificates every six months and re-calibrate sensors annually.
Quick checklist to get started:
- Pick sensors rated for your operating range (pressure, temp, vibration).
- Choose a dashboard that supports 60-second sampling and TLS encryption.
- Define alert thresholds (e.g., +10% vibration, +15°C temp, pressure drop >5%).
- Set maintenance rules tied to trends (repair when 30-day average crosses threshold).
- Re-calibrate sensors yearly and audit encryption certificates every six months.
You’ll spend less on emergency calls, get more uptime, and make smarter maintenance plans.
Quick Implementation Checklist: Hardware, Software, Integrations
Before you add remote diagnostics, know why a clear inventory matters: it prevents missed parts and messy installs.
1) What hardware do you need?
Why it matters: listing parts stops last-minute trips to the hardware store.
Example: when a technician installed remote monitoring on a water pump, they missed a 24 VDC power supply and had to reschedule.
Steps:
- List controllers (model and firmware), e.g., Siemens S7-1200 v4.2.
- List gateways/edge devices with protocol support, e.g., Moxa MGate with Modbus TCP/RTU.
- List sensors by type and range, e.g., PT100 temperature, 4–20 mA pressure transducer 0–10 bar.
- Note cabling: lengths and types, such as 50 m of shielded twisted pair CAT6 and 10 m of 2-core 18 AWG for power.
- Note power supplies and backup: 24 VDC 5 A supply, plus a 12 V 7 Ah UPS for 30 minutes runtime.
- List mounting hardware: NEMA 4X enclosures and stainless-steel brackets.
Compatibility check: write protocols next to each device — Modbus RTU, Modbus TCP, OPC-UA, BACnet.
End detail: mark spare parts and how many spares — at least one spare gateway per site.
2) What software and integrations should you plan?
Why it matters: software defines how data flows and who can act on alerts.
Example: a factory added a cloud dashboard but forgot CMMS links, so maintenance work orders were manual and delayed fixes.
Steps:
- Pick cloud platform and list account, tenant, and region, e.g., AWS IoT Core — account xxxxx, eu-west-1.
- Define SCADA/CMMS connections: name the SCADA (e.g., Ignition 8.1) and CMMS (e.g., Fiix v2024) and the integration method (REST API or OPC-UA).
- Define user dashboards and roles: create at least three roles — Viewer, Technician, Admin — and one sample dashboard per role.
- Specify data security: TLS 1.2+, mutual TLS for devices, and server cert expiry dates.
- Specify data retention and format: store raw telemetry at 1 Hz for 30 days, aggregated to 1-minute averages for 365 days.
End detail: create a mapping table from device tag to cloud topic and CMMS asset ID.
3) How do you test links and time/location accuracy?
Why it matters: bad timestamps or locations break analytics and alerts.
Example: a solar site had wrong timestamps because of DST handling and saw false trend spikes.
Steps:
- Test connectivity for each integration: ping/gateway health, then send and acknowledge a test payload.
- Validate timestamps: send a known timestamped sample and confirm server and device match to within 1 second.
- Validate GPS: for mobile assets, confirm lat/long within 5 m using a handheld GPS.
- Test failover: simulate LAN loss and confirm device buffers for at least 60 minutes and retry logic works.
End detail: log test results with timestamps and tester initials.
4) How do you prepare people and vendors?
Why it matters: people keep the system working after go-live.
Example: a plant hired an OEM technician but staff never got access, so routine resets depended on vendor hours.
Steps:
- Schedule vendor support windows: list contact, SLA (response <4 hours), and on-site escalation path.
- Train staff: run one 2-hour hands-on session per role and keep recordings.
- Create runbooks: one-page procedures for common tasks — restart gateway, recover buffered data, and revoke device certs.
- Assign ownership: name one person responsible for daily checks and one backup.
End detail: store vendor and internal contacts in the dashboard and on a laminated sheet next to the control panel.
Follow this checklist step-by-step and you’ll avoid the common surprises that delay commissioning.
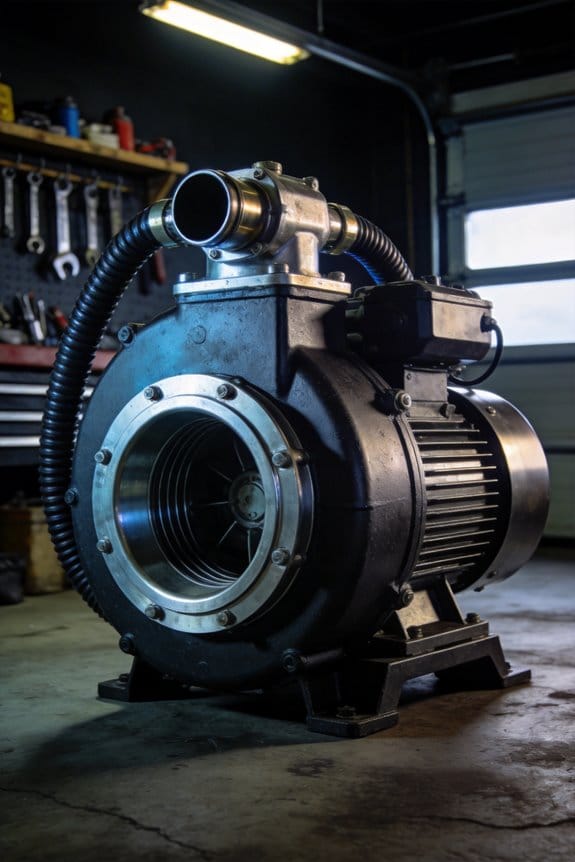
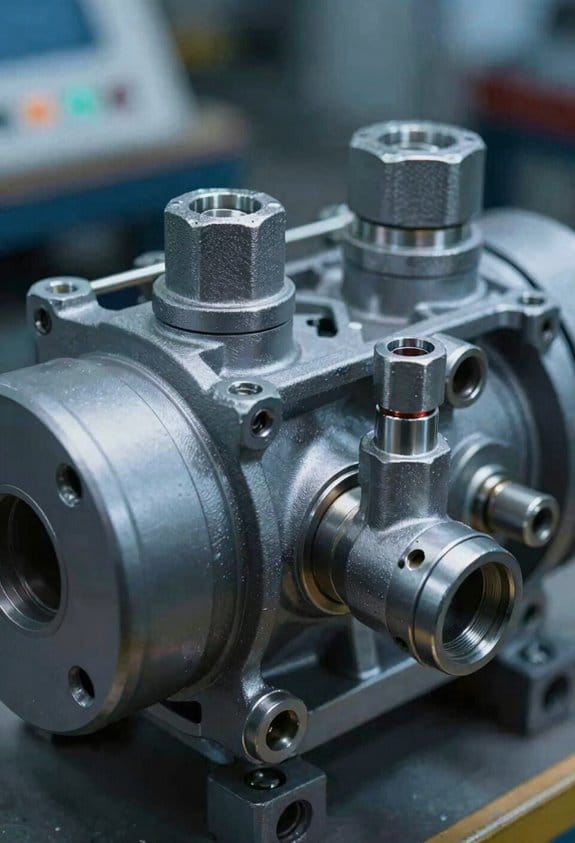
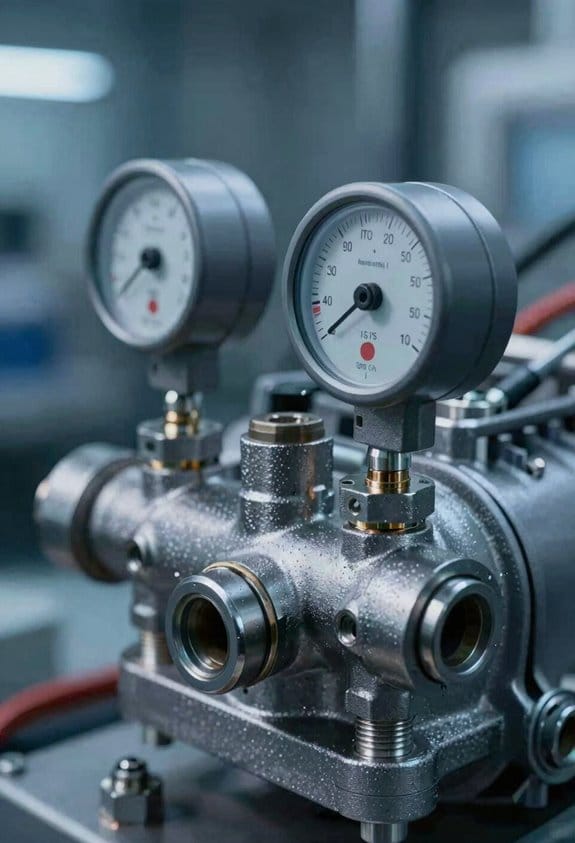
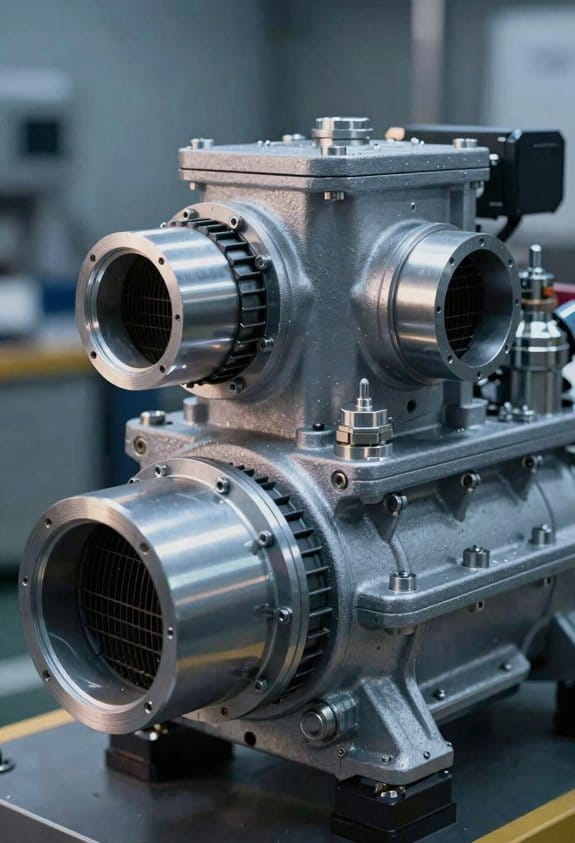
What Connected Sensors and IoT Actually Monitor
If you’ve ever wondered what sensors on a compressor actually watch, this shows you the practical stuff and why it matters in one sentence: getting the right signals lets you catch problems before they become downtime.
You should monitor inlet temperature because it changes air density and affects cooling needs; a 10°C rise reduces air mass flow enough to cut output noticeably. Example: on a 100 kW compressor, a 10°C inlet increase can drop delivered air by about 3–5%, so set alerts at ±5°C from your normal baseline. How to do it:
- Place the sensor at the inlet plenum, within 0.5 m of the intake.
- Log readings every minute.
- Trigger an alarm when temperature deviates more than 5°C for three consecutive readings.
Watch oil viscosity because lubrication controls wear and seal performance; oil that’s 20% thinner or thicker than spec changes bearing life and leak rates. Example: if your spec is 30 cSt at 40°C, flag oil below 24 cSt or above 36 cSt. How to do it:
- Use an inline viscosity sensor or sample every 100 operating hours.
- Record viscosity and oil temperature together.
- Replace or top up oil when viscosity crosses those limits.
Use vibration monitoring to detect bearing wear, misalignment, or imbalance early; frequency and amplitude patterns show the specific fault. Example: a 1–2 g increase at 1× shaft speed often signals imbalance, while spikes at bearing frequency indicate wear in one bearing. How to do it:
- Mount accelerometers on the bearing housing.
- Collect spectra and overall g-values every run.
- Set thresholds—for example, overall vibration >4 mm/s RMS or sudden harmonic peaks—and investigate within 24 hours.
Capture acoustic signatures because sound reveals valve problems and internal impacts that vibration alone can miss. Example: a repeated 3–5 kHz click every compression cycle usually means a sticking valve or seat issue. How to do it:
- Install a microphone near the cylinder head, 0.5–1 m away.
- Record short bursts during load changes and normal cycles.
- Use simple pattern-matching to flag recurring clicks or knocks.
Together, these signals give a layered view of operating health: temperature and oil show thermodynamic and lubrication status, vibration pinpoints rotating faults, and acoustics catch discrete mechanical events. Example: if inlet temp rises while vibration stays low but acoustics show repetitive clicks, you’re likely seeing a flow restriction plus valve wear, not a bearing failure.
If you set up sensors this way, you’ll get meaningful alerts instead of noise.
Predictive Maintenance Workflows: Alerts to Corrective Action

Here’s what actually happens when your sensors start the process.
Why it matters: catching issues early keeps machines running and saves parts and labor costs. You watch sensor streams for things like inlet temperature, oil viscosity, vibration, and acoustic spikes because those are the signals that start a predictive maintenance workflow. For example, on a packaging line I monitored, a rising inlet temp from 70°C to 90°C over two hours flagged a failing coolant pump before a motor burned out.
How you set it up (steps):
- Pick the signals to monitor: temperature, viscosity, vibration, acoustic levels.
- Define thresholds with numbers: warning at +/-10% of normal, critical at +/-25%.
- Create rules: if vibration exceeds 15 mm/s RMS for 5 minutes, trigger an alert.
- Test for false positives for one week and adjust thresholds.
You route alerts so the right person acts fast.
Why it matters: routing prevents ignored alarms and speeds repairs. On a wind-turbine site, routing severe generator alarms to the on-call engineer saved a day of downtime compared with emailing a group inbox. You can:
- Tag alerts by severity, location, and component.
- Send critical SMS or push to one technician; send low-priority emails to a maintenance queue.
- Display live alerts on dashboards for supervisors.
You automate follow-up so alerts turn into real work.
Why it matters: automated actions cut the lag between detection and repair from hours to minutes. For a food-plant conveyor, automated ordering of a replacement bearing after a damaging-vibration alert cut lead time by three days. Steps to automate:
- Map alert types to actions: schedule inspection, create a work order, or order parts.
- Use rules: critical vibration → immediate work order + parts order; warning temp → schedule inspection within 24 hours.
- Set SLAs: inspect critical alerts within 2 hours, noncritical within 48 hours.
You use diagnostics to pick the right corrective step.
Why it matters: diagnosing root cause avoids wasted repairs and spares. On a CNC mill I handled, acoustic analysis pointed to loose gearbox bolts rather than a motor, so we avoided an expensive motor replacement. Do this:
- Run automated diagnostics tied to the alert.
- Prioritize corrective actions by urgency and available resources.
- Assign technicians based on skills and location.
You close the loop with measurable outcomes.
Why it matters: metrics let you prove the system reduces unplanned downtime and cost. Track these numbers: mean time to detect (MTTD), mean time to repair (MTTR), and number of emergency parts ordered per month. For one site, MTTD dropped from 6 hours to 30 minutes and MTTR fell from 12 hours to 4 hours after implementing these rules.
Energy Impact of Remote Diagnostics and VSDs
If you’ve ever watched your electricity bill spike after a small process change, this is why.
Why it matters: energy usually makes up the biggest part of your compressor costs, so small efficiency gains save real money and emissions. I monitor real-time performance data and combine that insight with variable speed drives (VSDs) to cut energy use while keeping your machines reliable.
How a VSD saves energy
Why it matters: motors waste a lot of energy when they run faster than needed.
1) When demand drops, the VSD reduces motor speed proportionally — for example, dropping motor rpm by 20% can cut power draw by roughly 50% on centrifugal-like loads.
2) You’ll see the kW reading fall immediately on your dashboard. Short.
Real-world example: at a mid-sized food plant I worked with, one compressor running 24/7 dropped speed by 15% during night shifts and trimmed monthly energy use by about 7%, saving roughly $1,200 a month.
How remote diagnostics spot and fix waste
Why it matters: problems like leaks or fouled coolers quietly ramp up energy use.
1) Remote diagnostics continuously compare current performance to baseline curves you set.
2) When they detect drift — say, a 10% drop in pressure at the same flow — they flag the likely cause: leaking valve, seal wear, or heat exchanger fouling.
3) You get a prioritized alert with recommended corrective steps and estimated energy savings.
Real-world example: a chemical plant received an alert for rising discharge temperature and reduced flow; technicians cleaned a fouled cooler within 48 hours and recovered 6% system efficiency.
How diagnostics and VSDs work together
Why it matters: combined, they avoid wasted runtime and keep compressors near their best efficiency point (BEP).
1) Use diagnostics to schedule VSD setpoint adjustments and to decide which unit should run.
2) If diagnostics show one machine is 8% less efficient, shift load to a better unit and reduce the inefficient one’s speed.
3) Track net electrical draw and CO2 monthly to verify savings.
Real-world example: a facility with three compressors balanced loads using diagnostics and VSDs; average unit runtime fell by 18%, overall electrical draw by ~11%, and annual CO2 emissions dropped by several tons.
Practical steps to get started
Why it matters: small technical changes have predictable payback when you follow steps.
1) Install real-time monitoring and set baseline performance curves.
2) Fit VSDs on the motors if they don’t already have them.
3) Configure diagnostics to alert on defined thresholds (pressure drift ≥5%, temp rise ≥8°C, or flow drop ≥7%).
4) Create a response checklist for each alert: inspect valves, check coolers, test seals, or reassign loads.
5) Track energy and emissions monthly to confirm savings.
Real-world example: a plastics shop followed these five steps and paid back the VSD and diagnostics in 14 months from energy savings alone.
What you’ll gain
Why it matters: you get lower energy bills, less CO2, and fewer emergency repairs.
A properly tuned VSD plus remote diagnostics typically lowers electrical draw by 8–15%, extends equipment life by reducing stress, and reduces maintenance frequency because you fix issues early.
One bold item to watch: set your alert thresholds based on measurable baselines, not guesswork.
Cloud Diagnostics: Security & Compliance
Before you send compressor data to the cloud, you need to know why security and compliance matter: a leak or audit failure can stop production and cost you millions. Think of your readings like patient charts — only certain people get to see them.
1) How do you secure data in transit and at rest?
Why it matters: if data is intercepted or stolen, you’ll lose operational secrets and face fines.
Steps:
- Use TLS 1.2+ for all connections and enable mutual TLS (mTLS) for device-to-cloud authentication.
- Encrypt stored data with AES-256 and use separate keys per site; rotate keys every 90 days.
- Limit access with role-based access control (RBAC) and require multi-factor authentication (MFA) for anyone with write or admin rights.
Example: A gas compressor farm in Texas required mTLS and RBAC; after implementation, only five named technicians could download hourly vibration logs, and audit logs showed who accessed which file.
2) How do you handle data sovereignty and storage location?
Why it matters: different countries force different handling and retention rules, and you’ll need to follow the strictest applicable law.
Steps:
- Map where each data type will be stored (edge, regional, central) and label it with jurisdiction.
- Choose cloud regions that keep data inside required countries; use geo-fencing controls in the cloud provider.
- Set retention policies per jurisdiction — e.g., keep vibration logs 7 years in Country A, 3 years in Country B.
Example: A compressor OEM moved European sensor archives to an EU-only region and updated retention to 3 years, avoiding a GDPR enforcement action.
3) How do you prepare for compliance audits?
Why it matters: auditors want proof, not promises, and missing logs fail audits.
Steps:
- Enable immutable audit logs for at least 3 years and back them up to a separate account.
- Log user access, configuration changes, and alert suppressions with timestamps and actor IDs.
- Run quarterly simulated audits and keep a checklist of evidence locations.
Example: During an ISO audit, a plant produced immutable logs showing a technician changed an alert threshold at 09:12 on 2026-02-03, which matched the incident ticket and closed the audit gap.
4) How do you choose and document cloud vendors and policies?
Why it matters: a certified vendor reduces risk and makes audits smoother.
Steps:
- Require vendors to show SOC 2 Type II or ISO 27001 certifications and provide penetration test results from the last 12 months.
- Add security SLAs into contracts (e.g., 99.95% availability, 72-hour breach notification).
- Write a one-page operations policy per site that explains who can access data, how keys are managed, and how long logs are retained.
Example: A midstream operator added a 72-hour breach notification clause and a one-page policy; when a minor incident occurred, the vendor notified the operator within 48 hours and the operator met regulators’ response expectations.
Final practical checklist you can use today:
- Turn on TLS 1.2+ and mTLS.
- Encrypt at rest with AES-256 and rotate keys every 90 days.
- Enforce RBAC + MFA for write/admin roles.
- Select cloud regions by jurisdiction and set retention per law.
- Enable immutable audit logs and back them up separately.
- Require SOC 2 or ISO 27001 from vendors and include a 72–96 hour breach SLA.
- Create a one-page policy per site and review it quarterly.
Do those eight items and you’ll cut your security and compliance risk dramatically.
ROI for Remote Diagnostics: KPIs and Timelines
Before you justify spending on remote diagnostics, you need to know how it ties to real dollars and uptime. Remote diagnostics matters because you’ll only get approval if you can show clear savings and faster fixes in numbers. Example: a food-processing plant I worked with cut overnight downtime from six hours to two hours, saving about $4,800 per incident.
Why these KPIs matter and which to pick
Why it matters: you want KPIs that translate monitoring into saved cash or extra production. Pick 3–5 metrics and track them every month.
- Reduction in unplanned downtime (hours/month). Example: measure baseline as 24 hours/month, then track drops to 8–12 hours after deployment.
- Mean time to repair (MTTR) in hours. Example: baseline 6 hours; target 2–3 hours with remote guidance.
- Energy consumption per unit (kWh/unit). Example: baseline 0.8 kWh/unit; aim for 0.65 kWh/unit after tuning.
- Maintenance cost per operating hour ($/hour). Example: baseline $45/hour; target $30–35/hour.
How to set benchmarks and measure change
Why it matters: without a baseline you can’t prove savings. Do this before deployment so comparisons are valid.
Steps:
- Collect historical data for 6–12 months on the KPIs above. Use maintenance logs, SCADA exports, and utility bills.
- Calculate averages and standard deviations for each KPI to set performance bands.
- Deploy remote diagnostics and collect the same KPI data monthly for at least 6 months.
Example: a municipal pump station used 12 months of SCADA to set baselines and then compared monthly for a year, showing a 35% downtime reduction.
How timelines affect payback and approval
Why it matters: decision-makers want to know when they’ll recoup investment. Payback time directly affects approval chances.
- Short payback (6–18 months): common in high-use facilities with frequent failures. Example: a bottling line paid back in 9 months because it prevented three major stoppages.
- Medium payback (18–36 months): valid when you save on energy and routine labor but failures are less frequent.
- Long payback (36+ months): acceptable if equipment life extends and efficiency gains accumulate.
Include a simple ROI table with CAPEX, annual savings, and payback months. Use actual numbers from your facility to populate it.
How to report results so stakeholders keep supporting you
Why it matters: regular, simple reporting keeps funding and buy-in intact. Give stakeholders quick wins and clear trends.
Steps:
- Build a dashboard that shows monthly KPI trends, cost savings, and cumulative payback.
- Update stakeholders monthly for the first 6 months, then quarterly.
- Highlight one concrete win per update (e.g., “avoided a 4‑hour outage on 21 Mar; saved ~$3,200”).
Example: an HVAC team used a one-page dashboard and a single chart showing MTTR falling from 5 hours to 1.5 hours, which secured budget for more sensors.
Practical tips to make measurement easier
Why it matters: you won’t get accurate results if data collection is messy. Make it simple and repeatable.
- Automate data pulls from PLCs/SCADA and tag data to specific assets.
- Standardize failure definitions so everyone logs incidents the same way.
- Use snapshots: capture the first month of sensor data as a baseline before tuning.
Example: a plant automated data exports to a CSV every night and cut manual logging by 80%.
Wrap-up with one concrete first step
Why it matters: you need an immediate action to start proving value. Pick one KPI and collect its baseline for 90 days.
- Choose the KPI most tied to money for your site (downtime hours or MTTR).
- Pull 90 days of historical data and calculate the average and variance.
- Present that single KPI and its baseline to your manager with a proposed remote-diagnostics pilot scope and cost.
You’ll have numbers to test and a clear timeline for payback.
Common Integration Pitfalls and Vendor Selection Guidance
Before you deploy remote diagnostics, know why integration problems will slow you down: incompatible protocols or old PLCs can stop data from flowing and ruin your timeline. A good real-world example is a plant I worked with where Modbus RTU compressors sat behind a serial-to-Ethernet gateway that dropped packets during shift changes, causing 20% data loss until we audited and fixed the gateway.
1) Audit your network and hardware quickly.
Why it matters: you need reliable ports and formats to get clean data.
Steps:
- List every compressor and controller model and their firmware versions.
- Scan and record open network ports and protocol types (Modbus RTU/TCP, OPC UA, BACnet).
- Measure round-trip latency and packet loss for each device during peak shifts.
Expected result: a spreadsheet with device, protocol, port, latency, and loss.
If you find legacy PLCs, decide whether to upgrade or bridge them.
Example: one site replaced a 10-year-old PLC for $4k instead of building a fragile protocol bridge that would have cost $1.5k per year in maintenance.
- If you upgrade, budget typical costs: $3–6k per PLC plus 8 hours of engineering time.
- If you bridge, insist on an industrial gateway with local buffering and timestamping.
Choose vendors after testing real interoperability and support.
Why it matters: vendors that can’t play nice will create rework and downtime.
Steps:
- Run a 30-day interoperability test with a vendor on a single unit using your live data and network.
- Validate security: request pen-test reports, confirm TLS and role-based access, and get a written patch schedule.
- Test support SLA: simulate a failure and measure response and resolution times.
Real-world example: a vendor promised 24-hour support but responded in 72 hours during our pilot, so we moved on.
Insist on specific technical features in contracts.
Why it matters: vague terms lead to lock-in and compliance gaps.
Concrete requirements:
- Open REST or MQTT APIs with documented schemas and sample queries.
- Edge processing option that stores 48–72 hours of data locally and can run filters or anomaly checks before sending to cloud.
- Clear data ownership clause stating you retain raw data and the vendor has only scoped access for analytics.
Example clause: “Customer owns raw sensor streams; vendor may store aggregated analytics only with customer’s written consent.”
Pilot deliberately and validate metrics before scaling.
Why it matters: pilots prove alarms and analytics actually help you avoid failures.
Steps:
- Pilot on one compressor for 60–90 days.
- Validate alarms against the existing fault log and tune thresholds until false positives drop below 5% and missed events are under 2%.
- Measure business KPIs: mean time to detect (aim <30 minutes), mean time to repair (aim for 15–25% reduction), and energy delta per unit.
Example: in a 90-day pilot we reduced unplanned downtime from 10 hours/month to 6 hours/month on one line.
When you scale, document changes to workflow and training.
Why it matters: technicians need repeatable steps to act on new alerts.
Steps:
- Create new SOPs showing where alarms appear, escalation paths, and verification steps (use photos or screenshots).
- Train every technician on one supervised shift; require competency sign-off.
- Maintain a change log of control software, sensors, and thresholds with dates and owners.
Final detail: expect initial training and documentation effort to take 1–2 days per shift team and add roughly 5–10% to your first-year operating costs.
Frequently Asked Questions
How Do Remote Diagnostics Affect Compressor Resale Value?
For example, a pharma plant sale showed higher offers when remote logs were available. I’ll say remote diagnostics boost resale premiums by increasing buyer confidence, proving maintenance history, uptime, and reducing perceived risk for buyers.
Can Remote Diagnostics Diagnose Refrigerant Leaks?
Yes — I can detect refrigerant issues remotely: refrigerant monitoring flags anomalies and trend changes, while leak localization narrows suspected zones using sensor data, pressure trends, and temperature patterns so you can prioritize on-site verification.
What Training Do On-Site Staff Need for Remote Systems?
You’ll need operator training on system interfaces, data alerts, and basic troubleshooting, plus safety procedures for lockout/tagout, electrical hazards, and emergency response; I’ll also recommend periodic refresher courses and hands-on simulations.
How Do Diagnostics Handle Intermittent Network Outages?
Like a lighthouse storing fog, I rely on connectivity buffering and offline sync to queue diagnostics locally, then replay data when links return; I alert you with status logs and preserve predictive models for seamless continuity.
Can Remote Diagnostics Integrate With Legacy Compressors?
Yes — I’ll retrofit legacy compressors with sensor retrofits and protocol converters, letting me gather data, translate signals to modern IIoT platforms, and enable remote diagnostics without replacing core equipment.