You’re standing on the plant floor as a compressor trips again at 2 a.m., and the control room shows no obvious cause.
You’re asking exactly why these shutdowns keep happening despite routine inspections and oil checks.
Most teams treat each failure as a one-off and wait for obvious signs before acting.
This article shows how small, measurable changes in vibration, temperature, and oil condition predict failures, how sensor data flows into your CMMS to trigger graded alerts, and how automated work orders let you schedule repairs in low-load windows to avoid unplanned stops.
Follow these steps and you’ll cut emergency labor, extend component life, and reduce lost production.
It’s simpler than it sounds.
Key Takeaways
If you’ve ever been blindsided by a compressor trip, this is why.
Predictive sensors catch tiny vibration and temperature changes before they become failures, so you can schedule repairs on your terms. Example: a gas-compression site I worked with detected a 2% rise in shaft vibration over two weeks; they replaced a worn bearing on a planned Saturday and avoided a weekday shutdown.
Why this matters: you stop emergency breakdowns and control downtime.
Early fault detection turns emergency shutdowns into planned weekend maintenance, which cuts unplanned downtime hours dramatically. Example: one plant moved three emergency outages into two scheduled weekend jobs in a quarter and reduced lost production by 65% that period.
Why this matters: you save operating hours and predictable revenue.
Replace parts based on condition, not on a calendar, to extend life and lower costs. Steps:
- Install vibration and temperature thresholds for each component.
- Track readings weekly and flag items exceeding thresholds.
- Replace only flagged parts and log hours.
Example: a centrifugal compressor went from a 24-month to a 42-month bearing life after condition-based replacements, delaying a full overhaul and saving about $120,000.
Why this matters: you cut overhaul frequency and lifecycle expense.
Integrate predictive maintenance (PdM) with your CMMS or SCADA so work orders create themselves and technicians get process snapshots instantly. Example: when a sensor tripped a threshold, the system auto-generated a high-priority work order with the last 15 minutes of vibration and temperature charts attached, letting the crew start repairs with clear context.
Why this matters: you speed repairs and reduce diagnostic time.
Measure ROI from avoided downtime, lower emergency labor, and extra uptime over a 90-day pilot and you’ll see the value quickly. Steps:
- Record baseline unplanned downtime hours and emergency labor costs for 90 days.
- Run PdM pilot for 90 days and log the same metrics.
- Compare avoided hours, labor savings, and incremental revenue to pilot cost.
Example: a 90-day pilot showed 320 avoided downtime hours, $85,000 less emergency labor, and ~$210,000 in extra production revenue, paying for sensors and integration within the trial.
Why this matters: you justify scale-up with numbers.
Predictive Maintenance for Compressors: Impact & ROI
Before you switch to predictive maintenance, you need to know one thing: it changes where your money and time go. Predictive sensors catch small anomalies in vibration and temperature, and that lets your team schedule repairs before a compressor breaks down instead of reacting to emergency failures.
Why this matters: unplanned compressor downtime can cost you hundreds of thousands of dollars per incident. Example: a food-processing plant I worked with saved about $260,000 in lost production over six months after sensors flagged a bearing that was trending hotter by 4°C over two weeks; they replaced it on a planned weekend and avoided a 48‑hour shutdown.
How predictive maintenance improves ROI — in practical steps:
- Measure baseline: install vibration and temperature sensors and collect 30–90 days of normal operation data so you know what “normal” looks like.
- Set thresholds: pick alert levels like +3–5°C above baseline for temperature and a 10–20% rise in RMS vibration amplitude.
- Triage alerts: assign severity (low/medium/high) and response times — for example, low = inspect within 72 hours, medium = repair within 7 days, high = stop machine and repair within 24 hours.
- Track costs: log labor, parts, and downtime for each intervention to compare against past emergency fixes.
A concrete workflow that works: use sensors that stream to a dashboard, auto-generate alerts when thresholds are hit, and send a daily digest to the maintenance foreman with three prioritized actions. One manufacturing site reduced emergency call-outs from 6 per month to 1 per month within three months by following this routine.
You’ll also extend component life by catching wear early, so you replace parts when they actually need it rather than on a fixed calendar. Example: an automotive supplier extended compressor motor life by 18 months after switching to vibration trend monitoring and replacing shafts only when trends crossed a set threshold.
If you want reliable results, focus on three things:
- Data quality: clean sensor wiring and sample at appropriate rates (e.g., 4–8 kHz for vibration).
- Clear alerts: use numeric thresholds and response times tied to severity.
- Actionable processes: make sure an alert becomes a scheduled repair within your CMMS, not just an email.
Start small: pick one compressor line, run the steps for 90 days, and compare emergency labor and downtime costs before and after. You’ll see faster ROI if you target high‑value lines that would cost you most if they fail.
What Sensors and IoT Data Compressor PdM Needs
Before you set up predictive maintenance for compressors, know that the right sensors stop costly breakdowns by giving you early, actionable warnings.
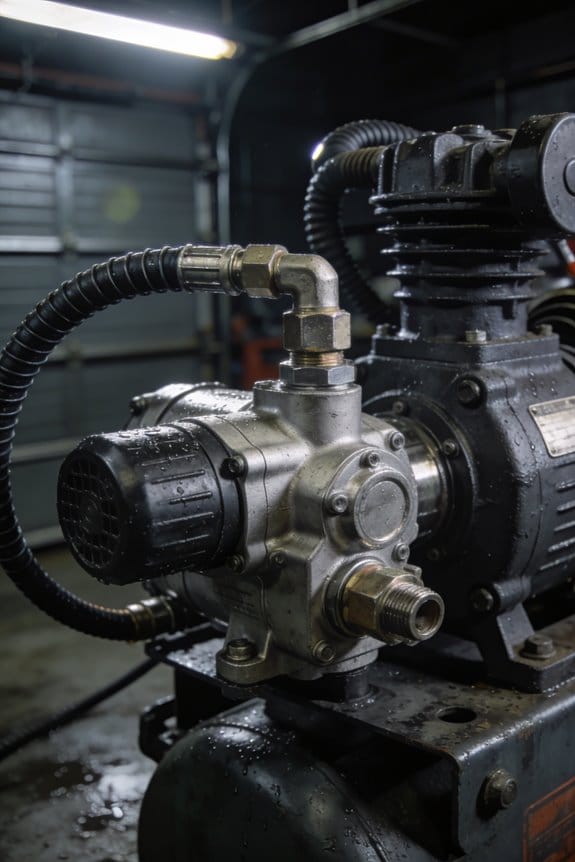
You need vibration sensors first because most mechanical faults show up there early. Put a tri-axial accelerometer on the compressor housing near the bearings and measure at 4–20 kHz with a 1 kHz sample rate for trend and alarm thresholds. Example: on a 50 hp rotary screw, install the sensor on the drive-end bearing housing and log RMS and peak values every minute — you’ll see imbalance creeping up weeks before failure. Use that data to set alerts at 3× baseline RMS.
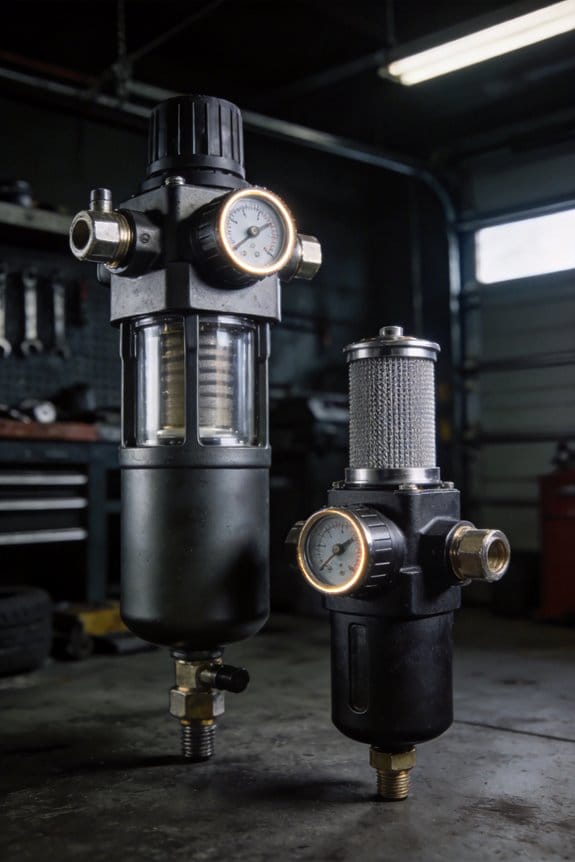
You also need pressure transducers to track suction and discharge performance since pressure shifts reveal leaks and valve failures. Install one transducer on the discharge line and one on the suction side, both rated for the system pressure (e.g., 0–300 psi). Example: a packaging plant caught a stuck discharge valve when the discharge pressure stayed 20% above normal for four hours; the sensor triggered a work order. Log pressures every 30 seconds.
Temperature probes catch overheating trends that precede failures; you won’t feel the problem until it’s late. Put thermocouples on bearing housings and motor windings, reading every minute with alarms at +10°C over baseline. Example: an HVAC fleet prevented motor burnout after a winding temp rose 12°C over three days and a technician replaced a failing motor bearing.
Flow meters reveal leaks or restrictions and show if the compressor delivers rated flow. Install a thermal mass flow meter or turbine in the main delivery line sized for your flow (e.g., 100–2,000 scfm). Example: a food processor found a clogged filter when flow dropped 18% while pressure rose, prompting a filter change and restoring throughput.
Add humidity sensors to prevent moisture-related corrosion and electrical insulation breakdown because moisture shortens component life. Place dew point sensors in the air receiver and log hourly; set an alert at dew point within 5°C of ambient temp. Example: a cold-storage facility spotted rising dew point before rust formed on valves.
Use oil quality sensors and particle counters to identify lubrication problems and contamination that wear parts fast. Install an oil debris sensor in the lube return line and a dielectric sensor for oil degradation; sample every 4 hours. Example: a compressor showed increasing ferrous particle counts over three weeks, leading to an oil change and bearing replacement before a seizure.
Monitor current and voltage on the motor to spot electrical stress and overloads so you can prevent motor failures. Use CTs and voltage taps on the motor starter, sample at 1 Hz, and track imbalance and harmonic content. Example: a bakery detected a creeping 8% current imbalance and found a misaligned coupling causing extra load.
How to wire these into IoT so you can act on them:
- Pick a gateway that supports MQTT and local buffering for at least 24 hours.
- Map each sensor to a clear tag name (e.g., COMP1_BEARING_TEMP).
- Send sensor readings at these cadences: vibration 1 min, temp 1 min, pressure 30 sec, flow 1 min, oil/particles 4 hrs, humidity 1 hr, electrical 1 sec.
- Set thresholds and maintain a 30-day baseline to reduce false alarms.
Example of a prioritized alarm rule: if vibration RMS > 3× baseline AND bearing temp +10°C for 6 hours, open a high-priority work order and schedule inspection within 24 hours.
Start simple: install the core sensors (vibration, pressure, temperature, flow) on one compressor, collect four weeks of data, then add oil, humidity, and electrical monitoring as you validate patterns. This staged approach keeps costs down and gets you meaningful alerts fast.
Which ML Models and Architectures Best Forecast Compressor Failures

If you’ve ever watched a compressor go from running smooth to tripping a week later, this is why you should pick the right model now: it keeps your plant online and saves you from emergency repairs.
Why ensembles first, and how to use them (what question: Which ensemble models work best?)
Why this matters: ensembles give reliable, explainable alerts you can act on.
Example: a gas-compressor skid where vibration spikes precede bearing failure by 48 hours.
Steps to try:
- Start with Random Forests: train with 100–500 trees, max depth 10–20, and use Gini or entropy; they handle missing values and give feature importance.
- Try Gradient Boosting (XGBoost or LightGBM): use 100–300 estimators, learning rate 0.05–0.2, and early stopping on a validation set to avoid overfitting.
- Validate with time-based splits: train on earlier months, test on later months to mimic future predictions.
- Use SHAP or permutation importance to rank top 10 signals (for example: RMS vibration, bearing temperature, oil particle count).
Result: you get a fast, interpretable model suitable for server-side scoring and quick prioritization.
When to use deep learning for time series (what question: When should you use deep nets?)
Why this matters: deep nets find temporal patterns that simpler models miss, improving lead time for failures.
Example: a centrifugal compressor where subtle cadence changes in 20 Hz vibration bands predict seal wear.
Steps to try:
1. Preprocess: resample sensors to a common rate (e.g., 200 Hz for vibration, 1 Hz for slow sensors), window into 5–30 second clips, and normalize per-sensor.
2. Model choices:
- 1D CNN: 3–6 layers, kernel sizes 3–11, batch norm, and global pooling for local feature extraction.
- LSTM/GRU: 1–3 layers with 64–256 units to capture longer sequences.
- Transformer encoder: 2–4 heads, embedding size 64–128 for complex cross-sensor attention.
3. Train with class weighting or focal loss if failures are rare (e.g., <1% of windows).
4. Evaluate with precision at fixed recall (for example, precision at 90% recall) and lead time distribution.
Result: you can detect evolving faults earlier, though you’ll need more data and compute.
How to combine models for better results (what question: How do you layer models?)
Why this matters: layering gives you both sensitivity and explainability so you can act confidently.
Example: you put a CNN on the edge to flag anomalies, then a LightGBM on the server to estimate remaining useful life.
Steps:
- Edge feature extractor: deploy a small 1–2 layer CNN (≤200k parameters) to emit 8–32 dimensional embeddings every 10–30 seconds.
- Server classifier/regressor: train a LightGBM on those embeddings plus slow sensors to predict failure probability or RUL.
- Calibrate probabilities with Platt scaling or isotonic regression using held-out data.
- Monitor drift by tracking embedding distribution and retrain monthly or after 500–1,000 new hours.
Result: you balance latency, bandwidth, and interpretability while keeping edge compute low.
Practical deployment tips (what question: How do you keep models useful in the field?)
Why this matters: a model that isn’t updated or is too big will stop helping you.
Example: a pipeline compressor that had model precision drop 30% after a seasonal temperature shift.
Steps:
- Keep models small for edge: aim for <5 MB and <100 MFLOPS for single-board computers.
- Retrain cadence: retrain quarterly or when performance drops >10% on a rolling validation metric.
- Ground truth collection: log trips and manual inspection results, and label failure windows within 24–72 hours after events.
- Test on historical failures: hold out full failure events (not random windows) to estimate real-world performance.
Result: your models stay accurate and actionable through changing operating conditions.
Final quick checklist you can act on today:
- Collect and sync sensors (vibration at 100–500 Hz, slow sensors at 1 Hz).
- Train Random Forest and LightGBM baseline with time-based validation.
- If you have >100 failure hours, prototype a small CNN or LSTM.
- Deploy small extractor on edge and server ensemble for final scoring.
- Retrain on a schedule and after labelled incidents.
If you want, tell me what sensors and sample rates you have and I’ll suggest concrete model hyperparameters and deployment targets for your hardware.
Quantify PdM Cost Savings for Compressors

Before you calculate PdM savings, know why it matters: you want to stop surprise compressor failures that cost time and money.
Here’s how I break the math down so you can run the numbers yourself. First, gather these four inputs for each compressor: annual unplanned downtime hours, cost per downtime hour (labor + lost production), planned maintenance hours and cost, and expected component life in years. Example: a centrifugal compressor runs 7,200 hours/year, has 40 unplanned hours/year, costs $5,000 per downtime hour in lost product and labor, and planned maintenance costs $50,000/year.
1) Estimate avoided failure cost.
- Multiply your annual unplanned hours by cost per hour.
- Subtract the planned maintenance cost you’d still pay.
Example: 40 h × $5,000/h = $200,000 avoided; minus $50,000 planned = $150,000 net this year.
Why this step matters: it gives your baseline annual savings.
2) Add lifecycle savings from longer component life.
- Tell me how many years you extend life with PdM (conservative: 20%).
- Calculate reduced replacement frequency and annualize the savings.
Example: a $600,000 overhaul every 5 years becomes every 6 years with PdM; that’s $600,000/5 = $120,000/year versus $600,000/6 = $100,000/year, so $20,000/year saved.
Why this step matters: it captures savings you won’t see immediately but that repeat.
3) Value the opportunity cost of extra uptime.
- Estimate revenue per uptime hour for the asset.
- Multiply by expected additional uptime from PdM.
Example: product margin is $10,000/hour and PdM reduces downtime by 10 hours/year = $100,000/year.
Why this step matters: it converts uptime into real revenue potential.
4) Combine and show a payoff timeline.
- Add the net annual avoided-failure savings, lifecycle savings, and uptime revenue.
- Subtract your PdM program cost (sensors, software, staffing) in year 1, then annual O&M for subsequent years.
Example: Year 1: $150,000 + $20,000 + $100,000 = $270,000 gross savings; PdM setup = $200,000, so net Year 1 = $70,000. Year 2+: net ≈ $270,000 − $40,000 O&M = $230,000/year.
Why this step matters: it shows when your investment pays back and how much you keep after.
A quick checklist to run this for your fleet:
- Collect uptime, unplanned hours, and cost/hour for each compressor.
- List planned maintenance costs and overhaul schedules.
- Estimate conservative PdM impacts: unplanned hours reduction (%) and life extension (%).
- Price PdM program: install, software, training, and annual support.
- Build a 5-year cashflow and compute payback year.
Real example: a plant with three compressors used these numbers—combined avoided failures $450k/year, lifecycle savings $60k/year, extra uptime $120k/year, PdM first-year cost $500k and annual O&M $100k. They hit payback in Year 2 and averaged $530k net savings/year after that.
If you want, send me your compressor counts, current downtime hours, and rough costs per hour and I’ll draft a simple 3-year cashflow for you.
Integrate PdM With CMMS, SCADA, and Production Schedules
Here’s what actually happens when you connect predictive maintenance (PdM) to the systems your team already uses: alerts only help if they show up where work gets done. Why this matters: you’ll stop emergency repairs by turning predictions into timely, low-impact actions.
How to map sensors to CMMS so work orders appear automatically
Why this matters: automatic work orders save planners time and reduce missed fixes.
1) Identify assets and tags: pick one naming convention (e.g., SITE-AREA-EQ#-SENSOR) and apply it to every sensor and asset record. Example: “PlantA-Boiler-03-Vib” maps the vibration sensor on Boiler 3 to its CMMS record.
2) Configure thresholds and trend rules: set a warning at a 20% deviation and a critical at 40% over a rolling 48-hour window. Example: if vibration RMS rises 25% over two days, flag a pending work order.
3) Automate work order creation: push alerts into CMMS via API or MQTT-to-HTTP connector that creates a task with failure mode, suggested labour hours, and spare parts list. Example: creation includes “Estimated 4 hours; spare: bearing #BR-57.”
4) Set planner acceptance rules: require planners to approve only critical tasks within 24 hours; non-critical tasks go into a backlog review. Example: a rule says “auto-create, hold non-critical for 7 days” to avoid noisy work orders.
Real-world example: on a paper mill you map a roll sensor named “Mill1-Roll-02-Temp” to CMMS asset ID 1122, then auto-create a 6-hour bearing-check order when trend crosses 30% in 72 hours.
How to sync PdM alerts with SCADA so operators get context
Why this matters: operators need live process data to judge whether a repair can wait.
1) Align timestamps and control tags: sync all systems to NTP time and use the same tag names or a lookup table so PdM alerts reference SCADA tags directly. Example: link PdM tag “FeedPump-01-Flow” to SCADA tag “PMP_F1_FLOW.”
2) Attach a snapshot of process data to each alert: include the last 15 minutes of pressure, flow, and setpoint values when you send the alert. Example: the alert shows flow trending down from 1200 to 950 L/min over 10 minutes.
3) Display context in operator HMI: push a short message and a link to the PdM chart into the SCADA alarm banner so operators can click for details.
Real-world example: in a water plant, when a turbidity sensor trends up, the SCADA banner shows the last 15 minutes of inlet flow and filter backwash status so the operator can decide whether to isolate a filter.
How to book repairs around production schedules
Why this matters: scheduling during low-load windows minimizes production impact.
1) Integrate with the production schedule API or export a read-only calendar feed (iCal). Example: pull daily shift loads and mark windows under 40% capacity as preferred repair slots.
2) Create booking rules: allow automated booking only in pre-approved low-load slots; if none exist within the next 7 days, escalate to planners. Example: if a repair needs 4 hours, auto-book the next 4-hour low-load window within 5 days.
3) Notify stakeholders with options: send planners two suggested windows and an impact estimate (units lost, estimated cost). Example: “Window A: Tue 02:00–06:00, estimated loss 120 units; Window B: Thu 22:00–02:00, loss 40 units.”
Real-world example: a bottling line schedules a motor replacement for 03:00 on Sunday when output is 30% of weekday peak, avoiding missed targets.
How to close the loop so completed work improves models
Why this matters: feedback turns repair outcomes into better future predictions.
1) Record outcome data: push work order results (failure code, parts used, root cause, measured pre/post values) back into the PdM dataset. Example: after bearing replacement, record pre-failure vibration at 8 mm/s and post-repair at 1.2 mm/s.
2) Retrain or update models regularly: schedule model retraining weekly or after 50 new labeled events, whichever comes first. Example: retrain when you’ve captured 50 completed repairs tagged “bearing failure.”
3) Track model performance: log prediction lead time and false positive rate; aim to reduce false positives by 15% in the first quarter after integration.
Real-world example: a factory tracks 75 compressor repairs, logs outcomes, retrains monthly, and cuts false positives from 22% to 7% in three months.
Operational checklist to get started (do these five things)
1) Standardize tag and asset naming across PdM, CMMS, and SCADA.
2) Sync clocks to NTP and verify timestamps.
3) Build an API connector to create and update CMMS work orders.
4) Add a SCADA banner that shows 15-minute process snapshots with alerts.
5) Require feedback fields on every completed work order for model training.
Example: start with one pump line, apply the checklist, and expect the first automated, low-impact repair within two weeks.
If you follow these steps, you’ll turn predictions into coordinated actions that respect operations and reduce downtime.
Common Compressor PdM Implementation Pitfalls : And How to Fix Them
If you’ve ever started a predictive maintenance program for compressors, this is why some fail fast.
Why it matters: projects stall when people who run the machines aren’t part of decisions, so issues go unnoticed until alarms fail. Example: at a chemical plant I visited, operators rejected a vibration sensor because it required a new conduit route they weren’t told about, and the PdM pilot missed three early faults.
1) How do you get stakeholders engaged?
Why it matters: without buy-in, sensors get ignored and thresholds get set wrong.
Steps:
- Hold a 2-hour kickoff workshop with operators, maintenance leads, and a manager — no more than 10 people.
- Walk the compressor skid together and pick sensor locations by consensus.
- Run a 4-week pilot on one unit, collect feedback weekly, then adjust.
Concrete details: schedule the workshop within two weeks of project approval, choose one compressor with recent faults for the pilot, and set review meetings on Fridays at 10am.
Example: at a gas plant, a Friday review caught a mistaken alarm threshold after the second week and avoided a shutdown.
2) How should you set data governance so models work?
Why it matters: inconsistent or missing data ruins model outputs.
Steps:
- Assign one data owner for the PdM dataset and list their contact.
- Create three retention rules: raw sensor (1 year), processed features (3 years), summary logs (7 years).
- Set access levels: operators (view), maintenance (view+annotate), data team (full).
Concrete details: store metadata in a shared spreadsheet with columns: sensor ID, location, install date, calibration date, owner. Approve the spreadsheet by signatures from the data owner and a maintenance manager.
Example: a compressor fleet in Texas regained trust after naming a single data owner and reducing missing timestamps from 12% to under 1%.
3) Where should you place sensors and tune baselines?
Why it matters: bad placement and defaults make alarms noisy and ignored.
Steps:
- Follow a placement checklist: within 10 cm of bearing housings for vibration, on the discharge side for pressure, and on the oil return for temperature.
- Collect 30 days of baseline data across normal operating windows before setting thresholds.
- Use rolling baselines and update them every 90 days or after any process change.
Concrete details: for vibration, set the initial alarm at 3x baseline RMS and a warning at 2x; log the baseline period start and end in the metadata sheet.
Example: an ammonia plant moved a vibration sensor 8 cm closer to the bearing and reduced false alarms from 15/month to 2/month.
4) How do you align alerts with production so they help, not hurt?
Why it matters: alerts outside production windows create unnecessary work and get ignored.
Steps:
- Map production schedules and tag alerts with the active production window.
- Suppress noncritical alerts during planned startups and shutdowns.
- Prioritize alerts: critical (requires immediate stop), high (inspect within 8 hours), low (investigate next shift).
Concrete details: integrate PdM alerts into the existing shift handover document and route critical alerts to the duty manager by SMS.
Example: after aligning alerts with a refinery’s turnaround schedule, the team reduced off-hours inspections by 40%.
Keep it practical: involve people early, assign clear data ownership and retention rules, place sensors by checklist and collect 30 days of baseline data, and match alerts to production windows.
Key Metrics to Track After Deployment to Prove Uptime and ROI
Before you start tracking metrics, know why they matter: they prove uptime gains and justify the money you spent.
I usually begin with a short list of specific metrics you can measure in weeks, not months. Track percentage uptime (goal: improve by 2–5 percentage points), mean time between failures (MTBF) in operating hours, and mean time to repair (MTTR) in hours so you can show reliability and response changes. Example: a factory that raises uptime from 92% to 95% on a 1,000-hour/month line avoids 30 hours of downtime, which you can convert to saved production minutes.
Why link failures to dollars? Because stakeholders respond to cost. Calculate avoided unplanned hours × your fully loaded cost per hour (labor + lost production + penalties) to attribute ROI. Example: if avoided hours are 30 and cost per hour is $4,000, report $120,000 avoided cost for that month.
How to set this up in practice:
- Define baselines — record three months of current uptime, MTBF, MTTR and average monthly maintenance spend.
- Instrument event logging — capture failure start/end times and tags (asset, shift, root cause).
- Calculate weekly and monthly deltas against baseline.
- Compute avoided cost each period: (baseline downtime − current downtime) × cost per hour.
- Report maintenance spend variance: actual vs. baseline and explain deviations.
I also track prediction-specific signals because model value isn’t just accuracy; it’s timing. Monitor prediction lead time (how many hours warning you get) and false alarm rate (count and percent). Example: if your model gives an average 48-hour lead time with a 10% false alarm rate, show a timeline of one saved failure with timestamps, predicted alert, and repair completion.
Display these on an uptime dashboard so your team can explore and trust the numbers. Include:
- Real-time uptime percentage and trend line.
- MTBF and MTTR gauges with baseline markers.
- A table of incidents with cost calculations and whether they were predicted.
- Filters for asset, shift, and month.
Finally, watch for signal drift and cost mismatches: if false alarms rise above 15% or lead time falls below the minimum you need (for many teams that’s 24–48 hours), adjust models or workflows. Example: after a surge in false alarms, a mining site tightened the alert threshold and reduced unnecessary inspections from 20 per month to 6, cutting wasted labor by 70%.
Frequently Asked Questions
How Does Pdm Affect Compressor Warranties and OEM Support?
Contrasting risks and assurances, I’d say PdM usually improves warranty alignment and support transparency by documenting condition-based care; I’ll consult OEM terms since some warranties require approved sensors and may alter support scope or costs.
Can Pdm Data Be Used for Regulatory Compliance Reporting?
Yes — I can use PdM data for compliance: I provide audit trails and standards alignment evidence, generate timestamped logs, performance summaries, and configurable reports to satisfy regulators and streamline audits while maintaining data integrity and traceability.
What Cybersecurity Risks Arise From Compressor Iot Deployments?
You might worry it’s overkill, but I’ll answer: IoT compressors face cyber risks like unauthorized access, firmware tampering, and data breaches; I recommend network segmentation, strict access controls, and regular firmware validation to limit exposure.
How Do Small Facilities Afford Pdm Implementation Economically?
You can afford PdM by adopting low cost sensors, phased rollouts, and shared monitoring services; I’ll help design pay-as-you-go setups, prioritize critical assets, and show ROI so you can fund adoption without huge upfront spending.
Will Pdm Recommendations Override Operator Control During Critical Production?
No — I won’t let PdM snatch operator autonomy; override protocols are designed so I alert and recommend, but operators keep final control, with clear escalation rules and safety interlocks that only trigger under predefined emergencies.