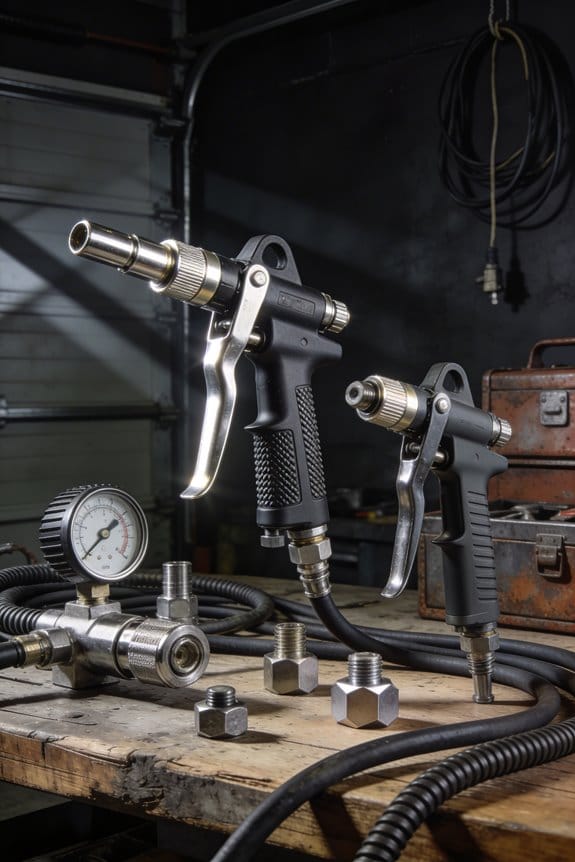
You’re in the shop at 3 a.m. with a broken pneumatic tool and a job overdue, staring at a failed part and asking why it failed now. You’ve traced the immediate cause—seized bearings, low oil, or a hidden leak—but you don’t know which data point would have warned you earlier.
Most teams treat tool failures as one-off luck or wait for visible damage before fixing anything. This piece shows exactly how to use simple usage data—runtime, cycle counts, pressure, vibration, temperature, and moisture—to predict failures, schedule maintenance, and stock the right spare parts so surprises become planned repairs. It’s easier than you think.
Key Takeaways
If you’ve ever grabbed an air tool that stopped mid-job, this is why.
Why it matters: spotting wear before failure saves you downtime and parts cost. Example: on a busy assembly line, a wrench that loses torque twice a week cost one plant three lost hours and one full fixture replacement last quarter.
How to use runtime, torque, and session minutes
Why it matters: those numbers show gradual wear or sudden clogs before the tool quits. Example: log shows average torque falling from 120 Nm to 100 Nm over three weeks on a bolting gun, and crews found a partially clogged air inlet.
Steps:
- Record runtime and session minutes per shift with a simple counter or IoT meter.
- Capture average torque each session and store the last 30 readings.
- Set a rule: if torque drops more than 10% over five sessions, flag for inlet and regulator check.
Tip: check the inlet screen first; it’s quick and often fixes the drop.
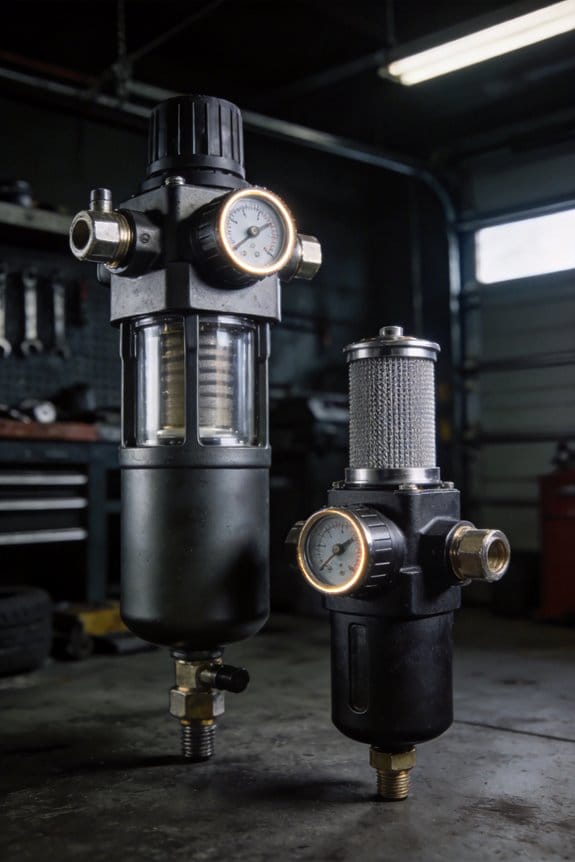
Log pressure peaks and drops during runs
Why it matters: pressure spikes or sudden drops reveal leaks or restrictions that reduce performance. Example: a painter’s spray gun showed 20 psi drops during long runs and the crew found a cracked hose clamp at the reel.
Steps:
- Install a pressure sensor at the tool feed and record max/min per run.
- Compare peaks to the rated operating pressure (for many tools, +/- 10% is acceptable).
- Create an alert for pressure drops greater than 15% during a run.
Tip: when you get an alert, inspect the hose, quick coupler, and fittings in that order.
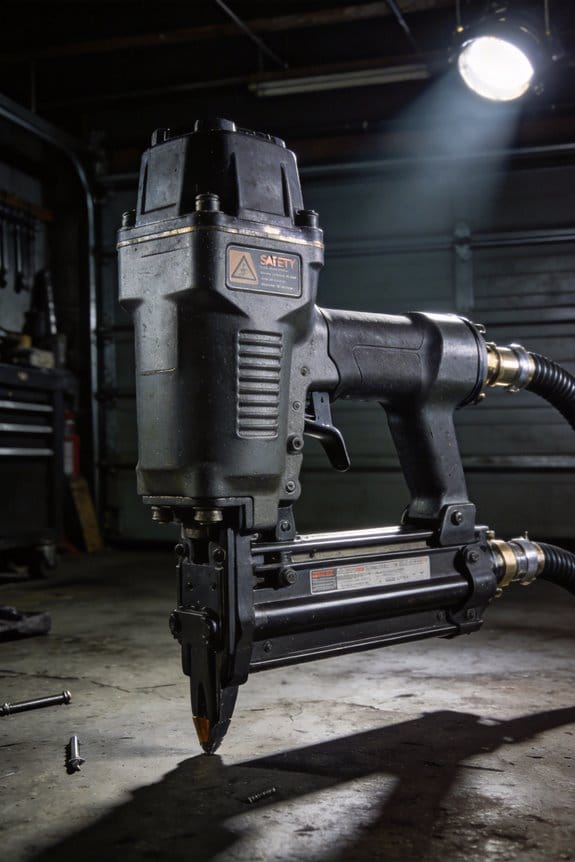
Count on/off cycles vs. rated life
Why it matters: cycles often wear parts faster than hours do, so counting them keeps you ahead of failure. Example: a shop counted 150 cycles per shift on a finishing gun that’s rated for 100,000 cycles; they moved to replace seals every 80,000 cycles and cut failures by half.
Steps:
- Count each on/off cycle with a counter or controller.
- Compare cumulative cycles to the tool’s rated life and schedule replacement at 80% of rated cycles.
- Shift the replacement time two shifts earlier if the tool is critical to production.
Tip: keep a small stock of common wear parts and stamps with the cycle count.
Monitor vibration and acoustic signatures
Why it matters: vibration and sound change before bearings or alignment fail, letting you fix the right part. Example: a compressor-driven riveter developed a high-frequency squeal; vibration logs showed a growing peak at 3 kHz and techs replaced a bearing before a seizure.
Steps:
- Fit a vibration sensor and a simple microphone on the tool or fixture.
- Log weekly spectra and watch for a consistent frequency spike or rising RMS level.
- Create a ticket when vibration RMS increases by 30% or a new spectral peak appears.
Tip: compare current spectra to a “baseline” taken after a fresh rebuild.
Automate alerts and work orders for thresholds
Why it matters: automatic triggers get a technician on site before the problem grows. Example: runtime hit 10,000 minutes and an automated work order scheduled a compressor valve rebuild, preventing a costly weekend outage.
Steps:
- Define thresholds: runtime, peak pressure, moisture level, and cycle count.
- Configure your system to send alerts and automatically create a work order when any threshold is crossed.
- Prioritize alerts: critical tools get immediate notifications; noncritical tools get batched daily.
Tip: include photos and the last three sensor readings in each work order so techs arrive prepared.
What Air-Tool Usage Data Reveals About Tool Health
If you’ve ever watched a wrench slow down on the last bolt, this is why.
Why it matters: spotting small changes in how your air tool runs helps you fix it before it breaks.
I look at runtime and load because they tell you how the tool handles normal jobs; a steady runtime increase of 10–20% over a month usually means wear, while a sudden jump to double the load often signals a clog or stalled parts. For example, your pneumatic impact gun that used to run eight minutes per job now needs ten—measure that; note dates and tasks. Check runtime weekly and log the minutes and average torque.
Vibration readings show bearing problems before they fail, which saves you time and money.
How to read vibrations:
- Place an accelerometer on the tool housing for 30 seconds while running at a typical load.
- Record peak frequency and RMS value; anything above a 15% rise from baseline over two checks deserves inspection.
- Compare frequencies: 1–2 kHz often points to bearing wear; lower spikes can mean misalignment.
Example: you hear a faint hum and the meter shows a 20% RMS rise at 1.5 kHz—that’s likely a worn bearing. Order the replacement bearing and schedule a 20‑minute swap.
Acoustic signatures help you tell whether noise comes from bearings, air leaks, or loose parts.
Why it matters: sound separates problems that look similar on paper.
Steps to use sound:
- Record a 10–15 second clip of the tool at normal pressure with a phone or mic.
- Listen for steady tonal peaks (bearing) versus broadband hiss (air leak).
- Match the sound to a labeled library clip or use a simple spectrogram app to check dominant frequencies.
Example: a sharp, repeating click at 3 kHz while the tool is under load matched a loose valve plate in a compressor; tightening the fastener removed the click.
Temperature trends reveal overheating risks, which cause seals and oil to fail.
How to check temp:
- Use an infrared thermometer once per shift, aiming for the same spot on the housing.
- Note readings; a 10°C rise over a week means you need to stop and inspect lubrication or airflow.
Example: your grinder’s housing hits 70°C while it used to be 55°C—open the air inlet and clean the filter, then recheck.
Oil-consumption logs indicate lubrication issues that shorten part life.
Why it matters: missing oil means parts grind and fail.
How to track oil:
- Measure oil level before the first shift and after the last shift for three days.
- If consumption exceeds manufacturer specs by 20% or you see metal flakes in the oil, change oil and inspect seals.
Example: you find the reservoir drops 30 mL per shift and tiny metal shavings—replace the oil and the seal, and keep daily 60‑second visual checks.
Pressure variations point to internal restrictions or hose problems.
Why it matters: pressure dips reduce power and stress internal parts.
How to monitor pressure:
- Install a gauge at the tool and record peak and low pressures during a run.
- A drop of more than 15 psi under load versus idle indicates a restriction or leak.
Example: your sander falls from 90 psi idle to 70 psi under load—check the hose for kinks and the filter regulator for clogging.
Cycle counts help forecast when parts reach end-of-life.
Why it matters: parts fail predictably after a number of cycles.
How to use cycles:
- Count full on/off cycles per job and total them daily.
- Compare totals to the part’s rated life; plan a replacement two shifts before the rated cycles to avoid downtime.
Example: a valve rated for 100,000 cycles shows 98,500 in your log—order the valve now and swap during the next maintenance window.
Put these data types together and you can schedule targeted inspections before failures occur.
Quick checklist for your first month:
- Log runtime and load weekly.
- Take one vibration and one acoustic recording per week.
- Measure housing temperature at shift start and end.
- Track oil level daily for three days each week.
- Record pressure during one representative run per shift.
- Count cycles per job and update the part-life spreadsheet.
Do this and you’ll catch problems early.
Key Metrics to Track (Runtime, Cycles, Pressure, Moisture, Leaks) and Thresholds

If you’ve ever had a tool fail at the worst moment, this is why.
Why it matters: tracking a few metrics keeps your tools running and prevents surprises. I focus on five things you can measure right now — runtime, cycle counts, operating pressure, moisture, and leaks — because together they tell you when to act.
Runtime — how long the tool runs each session
Why it matters: excessive run time causes wear and missed lubrication intervals.
1) Set a threshold: check and record runtime every hour for tools used continuously, or after every shift for intermittent use.
2) Action: if runtime exceeds 60 minutes in one session, stop for a 5–10 minute cool-down and add lubrication per the tool manual.
Example: on a production line wrench used non-stop, I logged hourly runs and found a bearing heat-up after 4 straight hours; a 10-minute pause and fresh lube dropped bearing temperature 12°F.
Cycle counts — how many actuations the tool makes
Why it matters: parts wear by cycles, not just hours.
1) Set a service interval: schedule major maintenance at 100,000 cycles for high-use air motors and 25,000 cycles for smaller impact tools.
2) Action: when a tool hits the interval, replace wear parts like vanes, seals, or brushes.
Example: a shop tracked an impact gun to 25k cycles, swapped the hammer assembly, and avoided a shaft failure that would have halted two machines.
Operating pressure — the air pressure feeding the tool
Why it matters: wrong pressure causes poor performance or damage.
1) Set limits: flag pressure below 90 psi or above 100 psi at the tool inlet.
2) Action: if below 90 psi check for clogged filters, long hose runs, or undersized lines; if above 100 psi check the regulator and relief valves.
Example: a tech noticed drops to 85 psi at the tool during peak hours, found a partially closed valve in the supply line, and restored proper torque immediately.
Moisture — water content in the air system
Why it matters: moisture causes rust and ruined seals.
1) Set a threshold: inspect the receiver and drain tanks daily if you see water or if dew point approaches 38°F.
2) Action: drain compressors daily when water shows, and install an auto-drain or a refrigerated dryer if daily draining doesn’t stop moisture carryover.
Example: a body shop that drained tanks daily prevented surface rust on pneumatic clamps and saved two clamp rebuilds in a year.
Leaks — how much air you lose between uses
Why it matters: leaks waste power and shorten compressor life.
1) Measure: do a pressure-decay test once per week — isolate a zone, pressurize to normal, shut off supply, and record pressure drop over 30 minutes.
2) Action: repair fittings or replace hoses that cause drops greater than 2 psi per 30 minutes.
Example: a garage cut its weekly compressor run time by 20% after finding and fixing three small leaks that caused a 5 psi decay per half-hour.
Put it together: a simple checklist
Why it matters: a checklist makes these checks repeatable and fast.
1) Hourly/shift: record runtime and pressure at tool inlet.
2) Daily: drain tanks, inspect moisture traps, and spot-check fittings for visible leaks.
3) Weekly: do a 30-minute pressure-decay test and log cycle counts.
4) At service intervals: replace wear parts at the cycle-count thresholds you set.
Start today: put a log sheet near the compressor or use a simple app, and record these five metrics for one week to establish baselines.
Integrate Sensors, Logs, and Staff Workflows for Real-Time Data

If you’ve ever walked past a machine that failed because a hose leaked, this is why.
Why it matters: connecting sensors, logs, and staff workflows stops small issues from becoming big failures in hours instead of days. Example: on a food-packaging line, a moisture spike in a seal head went from unnoticed to fixed in 30 minutes after integration, avoiding a full-shift shutdown.
How to set it up (step-by-step):
- Choose sensors and placement.
- Put vibration sensors on motors, moisture sensors on seal heads, and pressure sensors on hoses and lines.
- Example: mount a vibration sensor on the top flange of each conveyor motor about 3–4 inches from the shaft coupling.
- Route signals to a gateway.
- Use wireless gateways (LoRa or Wi‑Fi) near clusters of machines; one gateway can handle 20–50 sensors depending on range.
- Example: install a gateway in the ceiling grid above the line, 6–8 feet higher than the sensors.
- Centralize data on a server or cloud endpoint.
- Send sensor telemetry at 1 Hz for critical signals and 1/minute for status-only signals.
- Example: pressure readings at 1 Hz during production runs, every 60 seconds during idle.
- Add human workflows to the same feed.
- Replace paper checklists with mobile forms that post to the server with a timestamp and technician ID.
- Example: require a quick mobile form after every shift handoff with 5 fields: machine ID, visual check result, lubricant level, local temperature, remarks.
- Build a dashboard that surfaces action.
- Prioritize alerts by severity and time-since-event; show only the top 5 active issues per page to reduce clutter.
- Example: red alert for leaks (moisture > threshold), amber for runtime > 90% of scheduled duty cycle, green for normal.
- Automate flags and responses.
- Create rules: if moisture > 0.5% for 3 consecutive readings, send SMS to on-call tech and create a work order.
- Example: set a leak rule to open a ticket automatically and lock the asset from further runs after 5 minutes of persistent leak.
- Train staff and enforce usage.
- Train each technician with a 30‑minute hands-on session and one follow-up shift of supervised use.
- Example: give each tech a checklist card with three steps: open mobile form, attach photo, submit; require evidence for any override.
Human + device workflow benefits: when people and devices share one feed your maintenance becomes measurable and faster; you’ll see mean time to repair drop and missed actions disappear. Example: after switching to shared workflows, one plant cut unscheduled downtime by 40% in three months.
Practical checklist to get started (3 items):
- Pilot one line for 4 weeks with 10 sensors and mobile forms.
- Define 3 alert rules (moisture, pressure drop, runtime threshold).
- Hold one 30-minute training for all shifts and track mobile form compliance.
You’ll save time, reduce surprises, and have clear records for audits.
Map Usage Signals to Maintenance Actions and Schedules (With Examples)

If you’ve ever had a machine fail unexpectedly, this is why.
Why it matters: tying usage signals to actions stops small problems from becoming big, costly repairs.
1) When runtime hours hit a threshold, schedule lubrication immediately.
– Steps:
- Set a trigger at 100,000 cycles for gear heads (or 1,000 runtime hours if you track hours).
- Automatically create a work order and assign it to a technician.
- Log the lubricant type, quantity, and technician name in your maintenance system.
– Example: on a production line, a gear head hit 100,000 cycles on Tuesday; a work order assigned to Sam at 08:00 led to a 20-minute lubrication job and an entry showing 50 ml of grease used.
2) Place sensors where they actually read useful data.
- Why it matters: sensor placement gives you accurate oil-consumption and vibration readings so you make correct decisions.
- Steps:
- Mount oil-consumption sensors at the oil reservoir outlet within 10 cm of the fitting.
- Place vibration sensors on the gearbox housing near the bearing, not on a nearby pipe.
- Calibrate sensors monthly and record calibration date.
– Example: a plant moved a vibration sensor from an overhead beam to the gearbox housing and caught a bearing imbalance two weeks earlier than before.
3) If pressure drifts outside 90–100 psi, trigger checks and alerts.
- Why it matters: pressure drift can signal leaks or blockage that reduce performance and cause failures.
- Steps:
- Set an alert when pressure < 90 psi or > 100 psi for more than 2 minutes.
- Automatically schedule a pressure test and hose inspection within 4 hours.
- Generate a predictive alert to the on-shift technician and log actions taken.
– Example: pressure fell to 88 psi for three minutes at noon; the system sent an alert, a hose clamp was replaced at 14:30, and pressure returned to 95 psi.
4) When moisture spikes after shifts, start drying and filter checks.
- Why it matters: moisture causes corrosion and sensor errors if you don’t act quickly.
- Steps:
- Trigger drying protocols when humidity rises above 60% for more than 30 minutes after shift end.
- Assign filter inspection within 8 hours and replace if visual contamination > 20%.
- Record time spent drying and filter part numbers used.
– Example: overnight humidity hit 65%; techs ran an 80-minute dryer cycle and swapped a filter that showed 25% contamination.
5) Small leak indicators require clamp or seal replacement before load increases.
- Why it matters: small leaks grow under higher compressor load and lead to major failures.
- Steps:
- Define a small-leak alert threshold (e.g., 5% pressure drop over 24 hours).
- Assign clamp or seal replacement within 24 hours of the alert.
- Re-test at operating pressure and log leak status as “resolved” or “needs follow-up.”
– Example: a slow 4.8% pressure drop triggered a seal replacement the next morning; re-test showed no further loss.
Use these rules to map each signal to a task, timing, and person so your team knows exactly what to do when a sensor speaks.
Common Implementation Pitfalls and Practical Fixes
Why it matters: missed or bad data leads you to the wrong maintenance decisions in weeks, not months. I’ll point out specific fixes so you can avoid common traps on your shop floor.
1) Technicians won’t change habits without clear training.
Why it matters: if people skip steps, your data has gaps and you can’t trust trends.
Real example: on a CNC floor I worked with, operators skipped a five-step start checklist because it added 90 seconds per job, and monthly downtime metrics doubled with no clear cause.
How to fix it:
- Create a one-page checklist with 4 actions (power on, sensor self-test, log job ID, confirm runtime start).
- Train each technician in a 15-minute session and run a supervised shift for their first three uses.
- Reward compliance weekly with a $20 coffee-card raffle.
Do this for two weeks.
2) Budget limits kill rollouts unless you phase installs.
Why it matters: a stalled project wastes momentum and hides value.
Real example: a plant ordered 50 smart sensors at once, ran out of funds, and months passed before any data was actionable.
How to fix it:
- Buy 5 low-cost pressure sensors (around $150 each) for the worst three machines.
- Run those for 30 days to prove ROI with specific metrics (runtime hours, 10% fewer false stops).
- Expand in 10-unit batches as savings justify purchases.
Keep installation under one technician-day per sensor.
3) Poor thresholds create false alerts.
Why it matters: too many false alarms and technicians stop trusting the system.
Real example: an air-press system tripped every time ambient temperature rose 5°C, producing 200 ignored alerts a month.
How to fix it:
- Look up the tool’s spec sheet and set thresholds to spec limits plus a 10% buffer.
- Run a 14-day baseline and adjust thresholds if you see more than 5% false positives.
- Document thresholds and the reason in the sensor config file.
Record the initial and final threshold values.
4) Bad data hygiene produces noisy datasets.
Why it matters: inconsistent logs mean your analytics will miss patterns and misclassify failures.
Real example: two shifts used different job codes; a week of production showed a phantom 30% efficiency drop.
How to fix it:
- Standardize log fields: timestamp (ISO 8601), machine ID, job code, runtime seconds.
- Enforce formats with a simple script that rejects malformed entries and writes errors to audit.log.
- Schedule a 30-minute audit every Monday to fix or annotate bad entries.
Keep the audit script under 200 lines.
5) Maintenance actions aren’t tied to data outputs.
Why it matters: if data doesn’t trigger repeatable actions, you won’t reduce failures.
Real example: vibration spikes were logged but technicians performed different fixes; the machine failed again in two weeks.
How to fix it:
- For each alert type, write a two-step checklist: immediate action and follow-up verification.
- Attach the checklist in the alert notification and require a signed completion note.
- Track time-to-resolution; aim for 48 hours for medium-priority alerts.
Use the checklist as the record of work.
Follow these concrete steps, and you’ll get usable insights quickly instead of drowning in noise.
Frequently Asked Questions
How Do We Secure Data Privacy for Usage Logs and Sensor Readings?
I’d scream it from the rooftops: use Encrypted transmission end-to-end and Differential privacy to mask individual readings, enforce strict access controls, anonymize logs, audit all access, and rotate keys so your sensor data stays private and tamper-proof.
Can Usage Data Help Determine Tool Replacement Costs and ROI?
Yes — I use usage data for lifecycle costing and predictive ROI, estimating replacement timing, repair versus replace thresholds, and forecasting savings from reduced downtime, parts, and compressor strain to justify capital expenditures confidently.
What Training Time Is Required for Staff to Use Smart Maintenance Systems?
I’d estimate onboarding duration at 2–5 days, plus periodic refreshers; I’d perform a skill assessment in week one to tailor training, reducing time for experienced techs and ensuring competency for automated scheduling and inspections.
How Do We Handle Intermittent Connectivity in Remote Facilities?
I’d handle intermittent connectivity by using store and forward buffers and edge caching so devices log usage locally, sync when online, and let staff access cached maintenance data offline — ensuring uninterrupted monitoring and deferred uploads.
Are There Industry Standards for Air-Tool Usage Data Formats?
Yes — generally no single standard exists; however, industry groups adopt protocol formats and metadata schemas. I recommend open protocols, consistent metadata schemas, and vendor alignment to guarantee interoperable, reliable usage-data exchange across tools and systems.