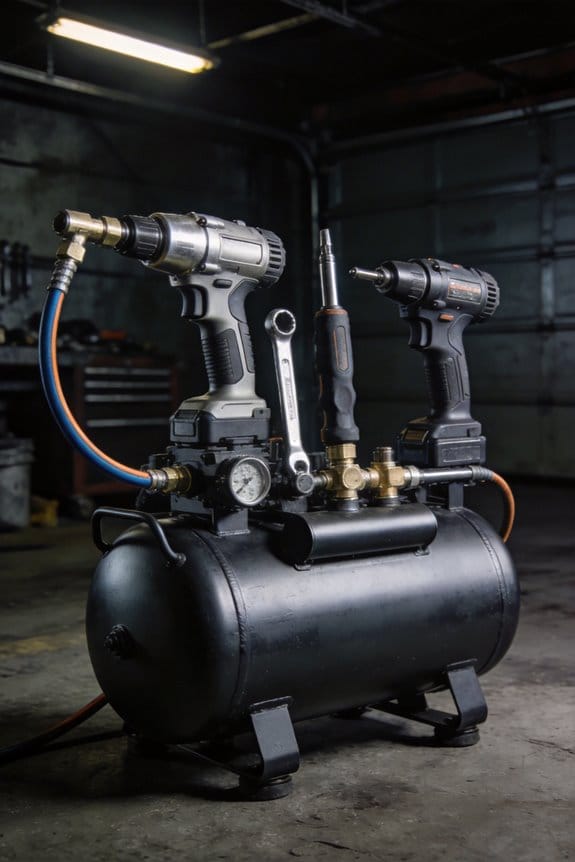
You stand in front of a bank of compressors while production flags and you can’t tell which valve, leak, or control is causing pressure drops.
The exact question is: which part of my compressed‑air system should I fix first to stop energy waste and surprise shutdowns?
Most people fix individual tools or chase leaks without checking the whole piping, controls, and load patterns.
This piece shows, step by step, how to map pipes and measure pressures, identify zoning and staging mismatches, and calculate the retrofit actions that will cut energy 5–20% and halve unplanned downtime.
You’ll get a prioritized, costed list of specific upgrades to implement next.
It’s easier than it looks.
Key Takeaways
If you’ve ever walked a shop floor and chased a leak, this is why.
– Your focus should shift from each tool’s specs to mapping the whole compressed-air network so you can find leaks, pressure drops, and where energy’s escaping. Example: walk the layout with a pressure gauge and ultrasonic leak detector, note drops greater than 10% between compressor room and end use, and tag leaks over 2 mm for immediate repair.
The difference between guessing supply and matching demand comes down to control.
– You save energy when system-level controls like VSDs, sequenced staging, and networked IIoT pressure sensors match compressor output to actual demand; that prevents frequent start/stop cycles and cuts energy use by 20–35% in many shops. Example: install a VSD on your lead compressor, set a 0.5 bar deadband, and watch average run time lengthen while power draw drops.
Think of pressure like water in pipes: you don’t need the same pressure everywhere.
– Use zoning and point-of-use boosters so low-pressure areas don’t force the whole plant to run at higher setpoints; that improves tool stability and lets you lower main header pressure by 0.3–0.7 bar. Example: separate paint booths and CNCs onto dedicated zones with local boosters tuned to the tool’s required 6–7 bar, while the rest of the plant runs at 5 bar.
Before you upgrade a compressor, check layout and piping first.
– Make lifecycle-cost choices that prioritize piping diameter, shorter runs, and maintenance access over swapping tools; larger pipes and fewer sharp bends can cut pressure drop by half, giving bigger energy and reliability gains than a new compressor in many cases. Example: replacing 25 m of 1-inch tubing with 1.5-inch pipe can reduce pressure loss from 0.3 bar to 0.12 bar at your typical flow.
You don’t need clean air everywhere if you segregate it.
– Concentrate oil-free systems and branch segregation where a process truly needs it, and run the rest on standard filtered air; that concentrates capital and operating costs only where required and can cut overall costs by 15–40%. Example: build a 2–3 line oil-free branch for food-packaging machines and keep the rest of the shop on standard compressors with coalescing filters.
Why System Thinking Wins for Compressed‑Air Systems
If you’ve ever walked into a noisy compressor room, this is why system thinking matters: it shows you where energy is leaking and what to fix first.
Why it matters in one sentence: fixing the whole compressed‑air network saves energy and cuts maintenance costs more than tinkering with a single compressor.
System thinking explained in practice
Start by mapping the whole air network: compressors, dryers, filters, piping, drains, and the tools at the end of the line. A simple hand‑drawn map with pipe diameters and distances works. Example: at a mid‑size shop I worked with, tracing a 150 m main line revealed three undersized 25 mm taps that dropped pressure by 0.7 bar at peak use.
How to get real gains — 4 clear steps
Before you change anything, measure baseline numbers so you can see improvements.
- Map flows and pressures
- Walk the plant and draw the network; label pipe lengths and diameters.
- Measure pressure at the compressor outlet and at three end‑use points during peak and light shifts.
- Example: measuring at the compressor (7.5 bar) and at a far tool (5.8 bar) showed a 1.7 bar drop because of small taps and a dirty separator.
- Track three metrics: system pressure, compressor run hours, and leak rate (m3/min).
- Use a temporary data logger if you don’t have a system monitor; record every 15 minutes for a week.
- Example: a bakery logged 0.6 m3/min of leaks and cut energy use 12% after fixing obvious leaks.
- Match supply to demand: stage compressors or use variable speed drives so you keep pressure within ±0.2 bar of target.
- Set minimum stable pressure at the nearest heavy‑use tool and allow the system to float rather than holding a single high pressure.
- Example: switching one fixed‑speed compressor to lead/lag control reduced unloaded running by 40% in a metal shop.
- Coordinate filter, dryer, and separator changes with compressor checks so you replace components before they cause pressure loss.
- Put simple checklist items on a calendar: check condensate traps monthly, replace filters every 6 months (or per pressure drop threshold).
- Example: a plastics plant combined filter changes with bearing greasing and cut unscheduled shutdowns from 5 to 1 per year.
- Value data and small tests. Use weekly pressure plots and compare them month‑to‑month. A chart that shows runtime dropping after a seal repair proves the work paid off.
- Make cross‑functional teams. Get one operator, one mechanic, and one engineer to meet monthly for 30 minutes to review metrics and decide one action.
- Example: a food‑packaging line held 30‑minute monthly huddles and found a leaking quick‑connect; fixing it saved 6% energy.
- Typical savings: 5–20% energy reduction from leak repair, control tuning, and removing pressure drop.
- Reliability: scheduled coordinated maintenance reduces unplanned downtime by 50% or more in many shops.
- Example: after mapping, monitoring, and two months of fixes, a machine shop reduced average system pressure from 6.9 to 6.4 bar and cut energy use 11%.
Organizational habits that make it stick
Why it matters in one sentence: your people and data habits determine whether efficiency gains persist.
What you can expect
Why it matters in one sentence: simple, low‑cost changes typically improve reliability and lower lifecycle costs without big capital projects.
Quick checklist you can use today
- Draw your system map this afternoon.
- Log pressure at three spots every 15 minutes for a week.
- Fix the top three leaks you find.
- Set a monthly 30‑minute review with operator/maintenance/engineer.
If you follow those steps, you’ll see measurable energy savings and fewer breakdowns without a big investment.
System Choices: Centralized, Modular, and Point‑Of‑Use Air Systems
Before you pick a compressed‑air layout, know that the choice affects your energy bill and equipment uptime.
If your plant is large and runs steady shifts, a centralized system usually costs less per kW and is easier to maintain because all the compressors live in one room. Example: a 100,000 ft² printing plant I worked with replaced three small compressors with two 125‑hp machines and cut energy use 12% by fitting larger dryers and a single aftercooler. How to evaluate it:
- Measure average and peak flow for a week (SCFM at system pressure).
- Size main compressors to handle 80–90% of average flow and one peak unit for spikes.
- Keep main piping >= 4 in. for runs over 200 ft to limit pressure drop to <5 psi.
End with a pressure map reading at the furthest workstation.
If your demand changes by area or over time, modular systems give you staged capacity and easier repairs. Example: a factory that added packaging lines installed three 75‑hp modular units and brought one online per shift, avoiding a costly oversized compressor. How to use modular:
- Choose modules that each cover 25–35% of your peak SCFM.
- Set controllers to run 1–2 units at base load and add modules on 10–15% demand jumps.
- Install local isolation valves and a simple PLC for sequencing.
End with confirmatory run hours logged monthly.
If you need stable pressure at tools or have long, leaky runs, point‑of‑use units save headaches by putting generation next to the machine. Example: a machine shop added 5–10 hp point‑of‑use boosters at CNC centers and eliminated a 7 psi drop that caused tool jams. How to deploy point‑of‑use:
- Identify tools needing ±1 psi stability and measure drop at peak use.
- Install boosters sized for the tool’s SCFM plus 20% margin.
- Keep supply hoses <50 ft and use 1/2–1 in. piping to reduce friction.
End with verifying tool cycle success rates.
You should zone your plant so similar loads share the same pressure and controls; zoning reduces wasted energy and makes troubleshooting fast. Example: grouping blow‑off and spray stations into a high‑flow zone cut a plant’s blower run‑time by 30%. How to create zones:
- Map loads and label zones on a floor plan.
- Group loads within 5 psi tolerance and similar duty cycles.
- Fit each zone with its own pressure sensor and an isolation valve.
End with a labeled floor plan taped in the compressor room.
Before you size piping and valves, remember pressure mapping tells you where to fix leaks and which runs need upsizing. Example: a pressure map found a 12 psi drop over a 300 ft line; swapping to 6 in. pipe reduced drop to 4 psi and lowered compressor unload time by 18 minutes per hour. How to do pressure mapping:
- Put calibrated gauges at the compressor room, mid‑run, and at end‑use points.
- Log pressures during peak and idle for 24–72 hours.
- Compare drops to target: <5 psi for critical runs, <10 psi elsewhere.
End with a prioritized list of lines to repair or rebore.
Choose based on three concrete things: your available footprint in square feet, how much your SCFM varies hour‑to‑hour, and whether you prefer easy service access or minimal pressure loss.
Tech Drivers: VSDs, Digital Twins, and IIoT for System Efficiency
Think of compressors and control systems like one smart machine that scales output to match real demand instead of running full tilt and wasting energy. Why this matters: matching output to demand cuts energy use and reduces wear, so your unit lasts longer and costs less to run. For example, a food-packaging plant I worked with dropped energy use by 25% after matching compressor output to production peaks using variable controls.
Start with VSDs (variable-speed drives). Why this matters: changing motor speed to match flow saves energy immediately. Steps:
- Measure current load profile for 2 weeks, logging pressure and run time every 1–5 minutes.
- Install a VSD sized to your motor—usually one rated at 110–125% of nameplate current.
- Tune the VSD to keep system pressure within a 0.3–0.5 bar band.
Concrete example: a small machine shop replaced throttling valves with a VSD on a 30 kW motor and cut motor energy by about 15 kW during average shifts.
Add IIoT sensors so your system reacts in real time. Why this matters: low‑cost sensors give controllers the data they need to orchestrate units and avoid cascading overrun. Steps:
- Place pressure sensors at the header and critical branches, and temperature sensors at motor bearings.
- Use wired or wireless gateways to send 1 Hz–1 min telemetry to your controller.
- Configure logic so each compressor ramps based on header pressure and motor temp, not just on/off setpoints.
Real example: at a beverage plant, adding four wireless pressure sensors eliminated pressure spikes during bottling runs and reduced start/stop cycles by 40%.
Use a digital twin to test changes before touching hardware. Why this matters: you can simulate setpoints, maintenance timing, and airflow without risking downtime. Steps:
- Build a twin using your measured load profile and unit curves (flow vs. pressure).
- Run scenarios: different setpoint bands, one compressor offline, and filter-clog progression.
- Implement the winning scenario in the controller and monitor results for 2 weeks.
Concrete example: modeling a clogged filter showed that delaying a filter change by one week increased energy consumption by 8%, so they moved to condition-based filter changes.
Integrate twin workflows into daily ops so simulations drive real actions. Why this matters: linking simulations to operations makes predictive maintenance practical. Steps:
- Set alerts for simulated failure thresholds (vibration, temp, pressure drop).
- Schedule maintenance tasks automatically in your CMMS when simulations predict a high likelihood of fault within 7 days.
- Track actual vs. predicted outcomes to refine the twin monthly.
Example: a plant scheduled a bearing change 10 days before failure because the twin predicted a rise in vibration; the team avoided an unplanned stoppage.
Put it all together for predictable savings. Why this matters: combined, these technologies reduce energy, extend equipment life, and lower operating cost. Quick checklist:
- Log 2 weeks of baseline data.
- Add VSDs where you have throttling or frequent starts.
- Deploy IIoT sensors at headers and critical components.
- Create a digital twin from your measured data.
- Automate maintenance tasks from twin predictions.
If you follow those steps, you’ll see measurable improvements—energy reductions in the 15–30% range are common—and your compressors will run more reliably with fewer emergency repairs.
Oil‑Free Compressors and Pneumatic Integration: Steps & Best Practices

Before you integrate oil‑free compressors with your tools, you need to know why it matters: oil‑free air prevents contamination of sensitive processes and reduces downstream maintenance.
1) How do you map your system and identify point‑of‑use needs?
Why it matters: mapping shows where clean air is actually required so you don’t over‑engineer the whole plant.
Steps:
- Walk the facility and list every pneumatic device with location, required pressure (psi/bar), and typical duty cycle (minutes per hour).
- Measure current flow at representative points using a clamp‑on flow meter or portable air logger for 1–2 typical shifts.
- Mark lines that contact product or instrumentation as “critical clean” on your drawing.
- Note ambient conditions (temperature, humidity) near compressors and critical lines.
Real example: On a food packaging line I worked on, mapping revealed only two of eight branches needed oil‑free air; switching just those branches saved the company $12,000 annually.
2) Which oil‑free compressor specs should you choose?
Why it matters: picking the right size and pressure margin avoids short cycling and low‑pressure faults.
Steps:
- Select a compressor that delivers 20–30% more flow (cfm or l/min) than your measured peak demand to cover startup spikes.
- Choose a unit that maintains required pressure with <10% fluctuation at peak load.
- Prefer units with a defined particulate spec (e.g., ISO 8573‑1 Class 1 for oil) and documented mean time between failures (MTBF).
Real example: A lab needed 60 cfm at 100 psi peak; specifying a 75 cfm oil‑free unit eliminated pressure drops during simultaneous valve actuations.
3) How do you size and place dryers and filters?
Why it matters: removing moisture and particles prevents corrosion and keeps tools working reliably.
Steps:
- Size dryers for peak flow plus 10% margin; if using desiccant dryers, schedule regenerations based on actual dew point and load.
- Install a pre‑filter at the compressor outlet (coalescing, 5 µm), then a desiccant or refrigerated dryer, then a final point‑of‑use filter (0.01–1 µm depending on need).
- Put pressure gauges before and after major treatment stages so you can spot blockages.
Real example: In a paint shop, adding a 1 µm final filter at spray booths reduced rejects by 40% within a month.
4) Where do you use corrosion‑resistant piping and fittings?
Why it matters: corrosion creates particles that defeat the purpose of oil‑free compression.
Steps:
- For critical lines, use stainless steel (304 or 316) or copper tubing; use anodized aluminum where compatibility is confirmed.
- Use stainless or brass fittings with PTFE tape or compatible sealant; avoid cast iron and black pipe on critical runs.
- Install drip legs and automatic drains at low points; check weekly for proper operation.
Real example: A cosmetics plant replaced 100 m of black pipe with 316 stainless on transfer lines and cut particulate incidents from weekly to near zero.
5) How should you design manifolds, isolation valves, and maintenance access?
Why it matters: proper layout keeps outages short and limits contamination during work.
Steps:
- Use dedicated manifolds for sensitive zones with individual shutoffs for each branch.
- Include isolation valves upstream of point‑of‑use filters so you can change filters without depressurizing the whole system.
- Place service ports and sample points at accessible heights and label them with pressure and flow data.
Real example: Adding isolation valves to a semiconductor tool rack reduced maintenance downtime from 3 hours to 30 minutes per intervention.
6) What sensors should you add for reliability?
Why it matters: simple monitoring finds leaks and pressure drops before they cause failures.
Steps:
- Add pressure transducers at compressor discharge, after dryer, and at critical point‑of‑use locations; set alarms for >10% deviation.
- Install basic leak detection (acoustic or flow‑based) on main headers and schedule quarterly leak audits.
- Log dew point and set alerts for excursions above target (for example, >+3°C over spec).
Real example: Installing a dew point alarm caught a failing dryer heater and prevented expensive corrosion in downstream valves.
7) What operator practices and purge routines should you train for?
Why it matters: operators are the last line of defense against contamination and downtime.
Steps:
- Teach operators to run a timed purge on lines after shut down—5–10 pipe volumes flushed at working pressure is a good rule.
- Train them to read gauges, recognize a clogged filter (pressure drop >10 psi across a stage), and swap point‑of‑use filters using isolation valves.
- Keep a simple checklist: drain traps, check drain operation, verify dew point, and log any anomalies daily.
Real example: A small plastics shop implemented a 5‑point daily checklist and cut line purge faults from weekly to monthly.
Final practical checklist (quick actions you can do this week):
- Walk and mark all point‑of‑use devices and record required psi and estimated flow.
- Add a 20–30% safety margin to your peak flow when sizing compressors.
- Install pre‑filter, dryer, and point‑of‑use filter in that order with pressure gauges.
- Convert critical lines to stainless or copper and add isolation valves on manifolds.
- Put pressure, dew point, and leak sensors on key locations and set simple alarms.
- Train operators on a short purge routine (5–10 volumes) and a daily checklist.
If you want, send a sketch or list of your plant layout and I’ll show exactly where to place compressors, dryers, and valves.
ROI & Lifecycle Impact: Energy, Maintenance, and Sustainability
Before you choose a compressor, you need to know how energy and maintenance affect cost and emissions. That matters because energy usually makes up the biggest share of your operating bills, so a small efficiency change can save you hundreds to thousands per year.
The difference between fixed-speed and VSD machines comes down to matching output to demand. A VSD (variable-speed drive) adjusts motor speed to meet air demand, cutting energy waste; in many shops that run 3,000–4,000 hours a year, you’ll see payback in 6–24 months when electricity costs $0.10–$0.30/kWh. Example: a machine that uses 50 kW at full load but averages 30 kW with a VSD can save ~20 kW × 3,500 hours = 70,000 kWh per year, which at $0.12/kWh is $8,400 saved.
Why regular maintenance matters: it keeps efficiency high so your savings actually happen. A simple predictive program reduces surprise failures and keeps your compressor within a few percent of rated efficiency, preserving ROI. Example: install vibration and temperature sensors, set alerts for a 10% rise in power draw, and schedule a targeted service visit — that often prevents a $10,000 gearbox failure.
Lifecycle choices cut your total footprint because materials and longevity set embodied emissions. Pick models with durable components and documented recycled-material content to lower upfront impact. Example: choose a compressor with a 15-year expected life and replaceable airends; if the airend is remanufactured at 40% lower embodied carbon, your lifecycle emissions fall substantially.
Concrete steps you can take now:
- Calculate your baseline: measure average kW draw and annual hours to get kWh/year.
- Compare options: estimate energy for fixed-speed vs VSD using your kWh/year and your utility rate.
- Implement predictive maintenance: install sensors, set a 10% power increase alert, and contract quarterly checks.
- Assess lifecycle: ask vendors for expected life, remanufacturing options, and percent recycled materials.
A quick real-world check: a mid-sized shop swapped a fixed-speed 75 kW unit for a 75 kW VSD, tracked 65% load factor instead of 85%, and cut annual energy by ~30,000 kWh — saving about $3,600 at $0.12/kWh while avoiding two unplanned outages the first year.
Frequently Asked Questions
How Do Insurance Policies Change for Facilities Moving to Centralized Air Systems?
They’ll need policy adjustments for centralized air risks; I’ll explain: insurers favor risk pooling, higher limits, updated business‑interruption clauses, enhanced maintenance clauses, and stricter loss-prevention standards, often lowering premiums if centralized controls and redundancy exist.
Can Legacy Pneumatic Tools Be Retrofitted to Smart IIOT Controllers?
Yes—I can retrofit legacy pneumatic tools using legacy retrofits and protocol gateways; I’ll add sensors, edge controllers, and gateways to translate signals to IIoT platforms, enabling monitoring, predictive analytics, and centralized control without replacing every tool.
What Workforce Skills Are Needed to Manage Digital Twins and Predictive Analytics?
Like a ship’s navigator, I’ll say you need data-savvy engineers with analytics literacy, systems integrators versed in digital twin governance, predictive-maintenance specialists, IIoT technicians, and change managers who’ll bridge ops and IT while training hands-on crews.
How Do Noise and Vibration Regulations Affect Modular Point‑Of‑Use Placement?
I consider noise zoning and vibration mapping essential: they force me to place modular point‑of‑use units where thresholds are met, add isolation or enclosures, and adjust layouts to protect personnel and comply with regulations.
Are There Supply‑Chain Risks for Specialized Compressor Spare Parts?
Yes—67% of firms report supply issues; I worry about obsolescence risk, long lead time, counterfeit components and reliance on a single supplier, so I push for dual sourcing, stockpiles and digital inventory monitoring.